The Great British Pound
Since it’s top in November 2007, the POUND has followed a nice script. It’s been extremely hard, I can imagine, for long term trend systems because it’s been stuck, I believe, in a multi-year triangle. As you can see from the charts, if this analysis is correct, then new lows below 1.3500 will be a reality. What I believe might have just completed is a 6+ month expanded flat correction, which appears to be the top of wave 2. I have not entered, yet. Am waiting for some confirmation and a lower time frame pattern to appear to allow me to manage risk. Please see the charts below and let me know if you have any questions.
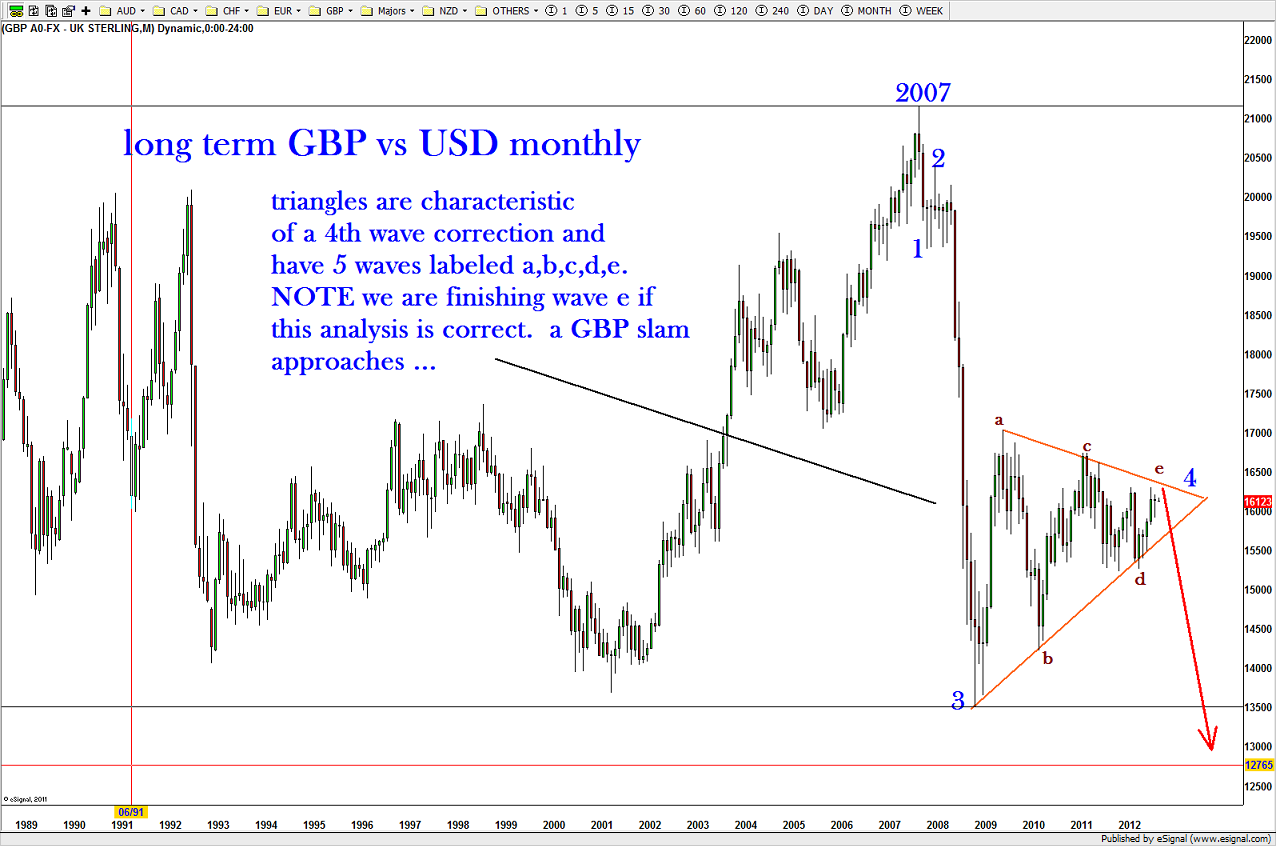
Long term monthly chart showing the potential completion of the 5 wave triangle ….note, the area for wave (e) to complete
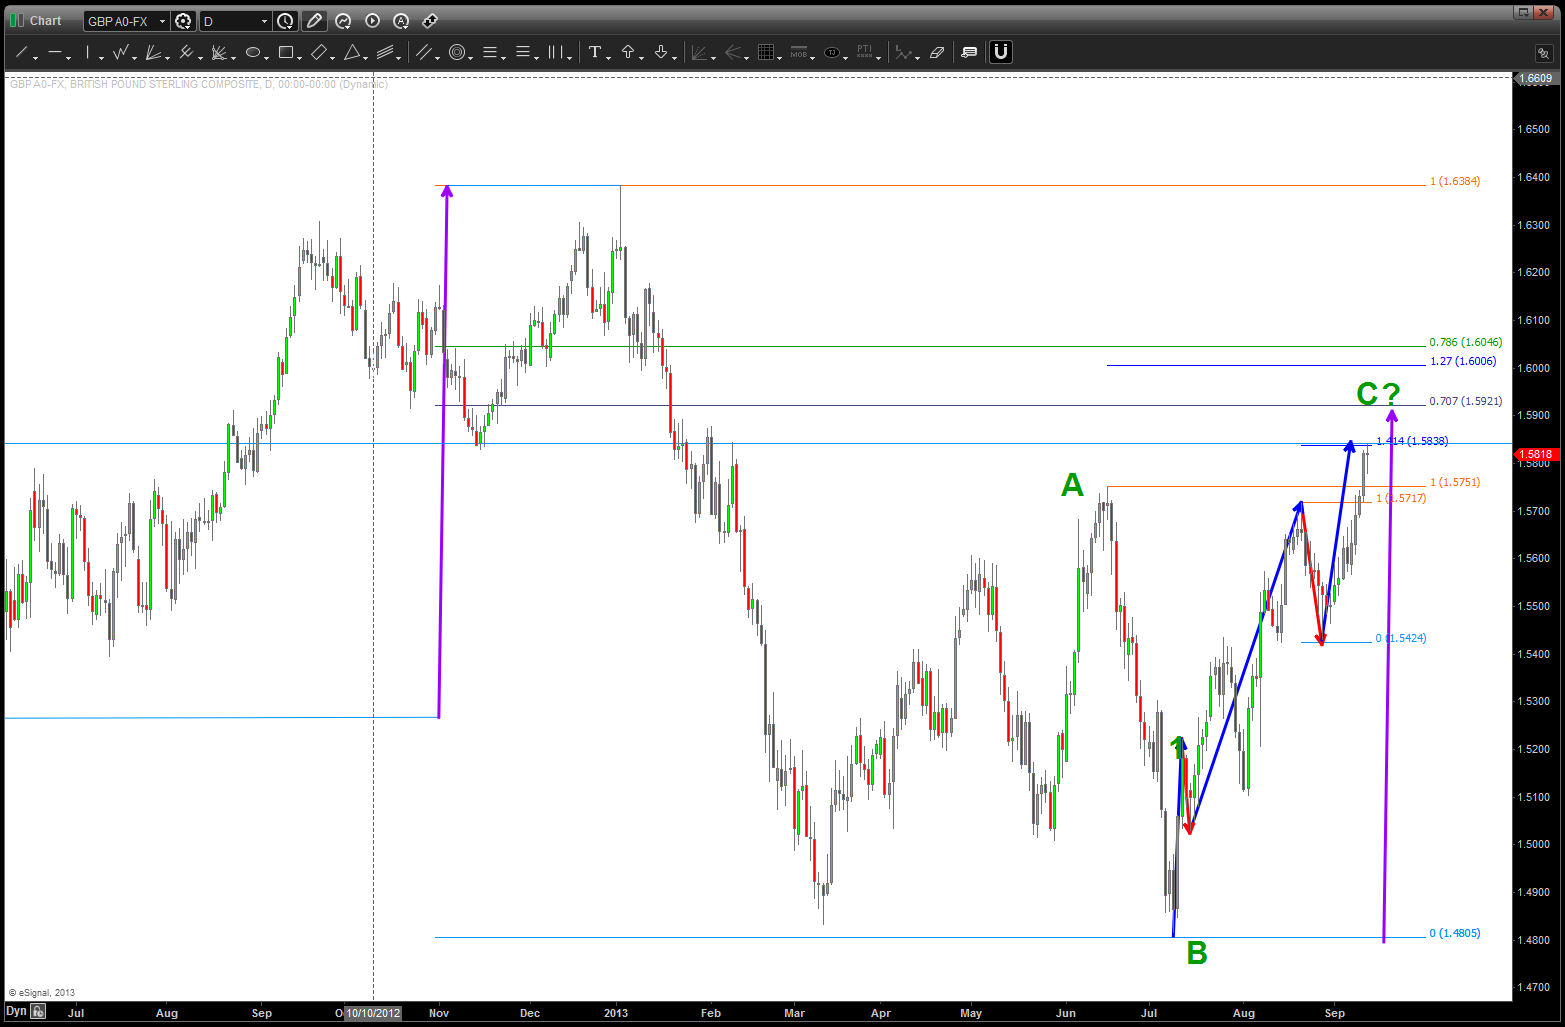
Daily chart showing the flat correction completed
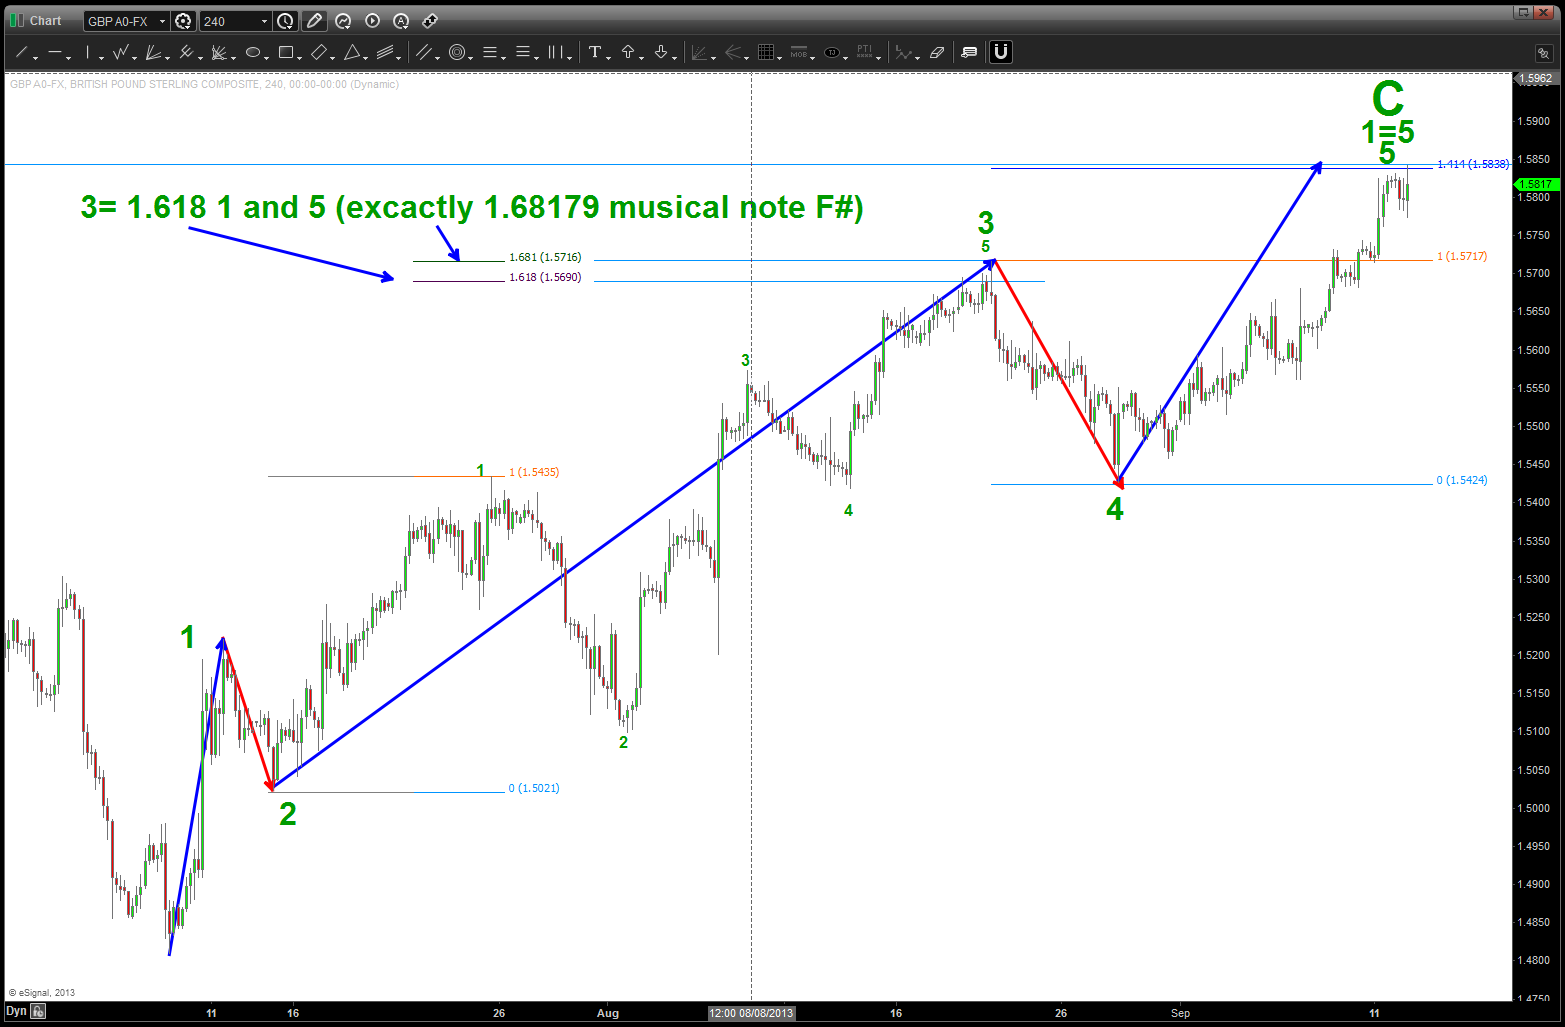
“Internals” of the final wave. Note the symmetry of wave 1=wave 5 and 1.618 wave 1/5 = 3. Very nice form, proportion here

Pingback: Great British Pound – again | Bart's Charts