Housing … just keep your head in the sand OR are the clouds forming? 4th update
06/20/2017 – update.
_______________________________________________________________________________________
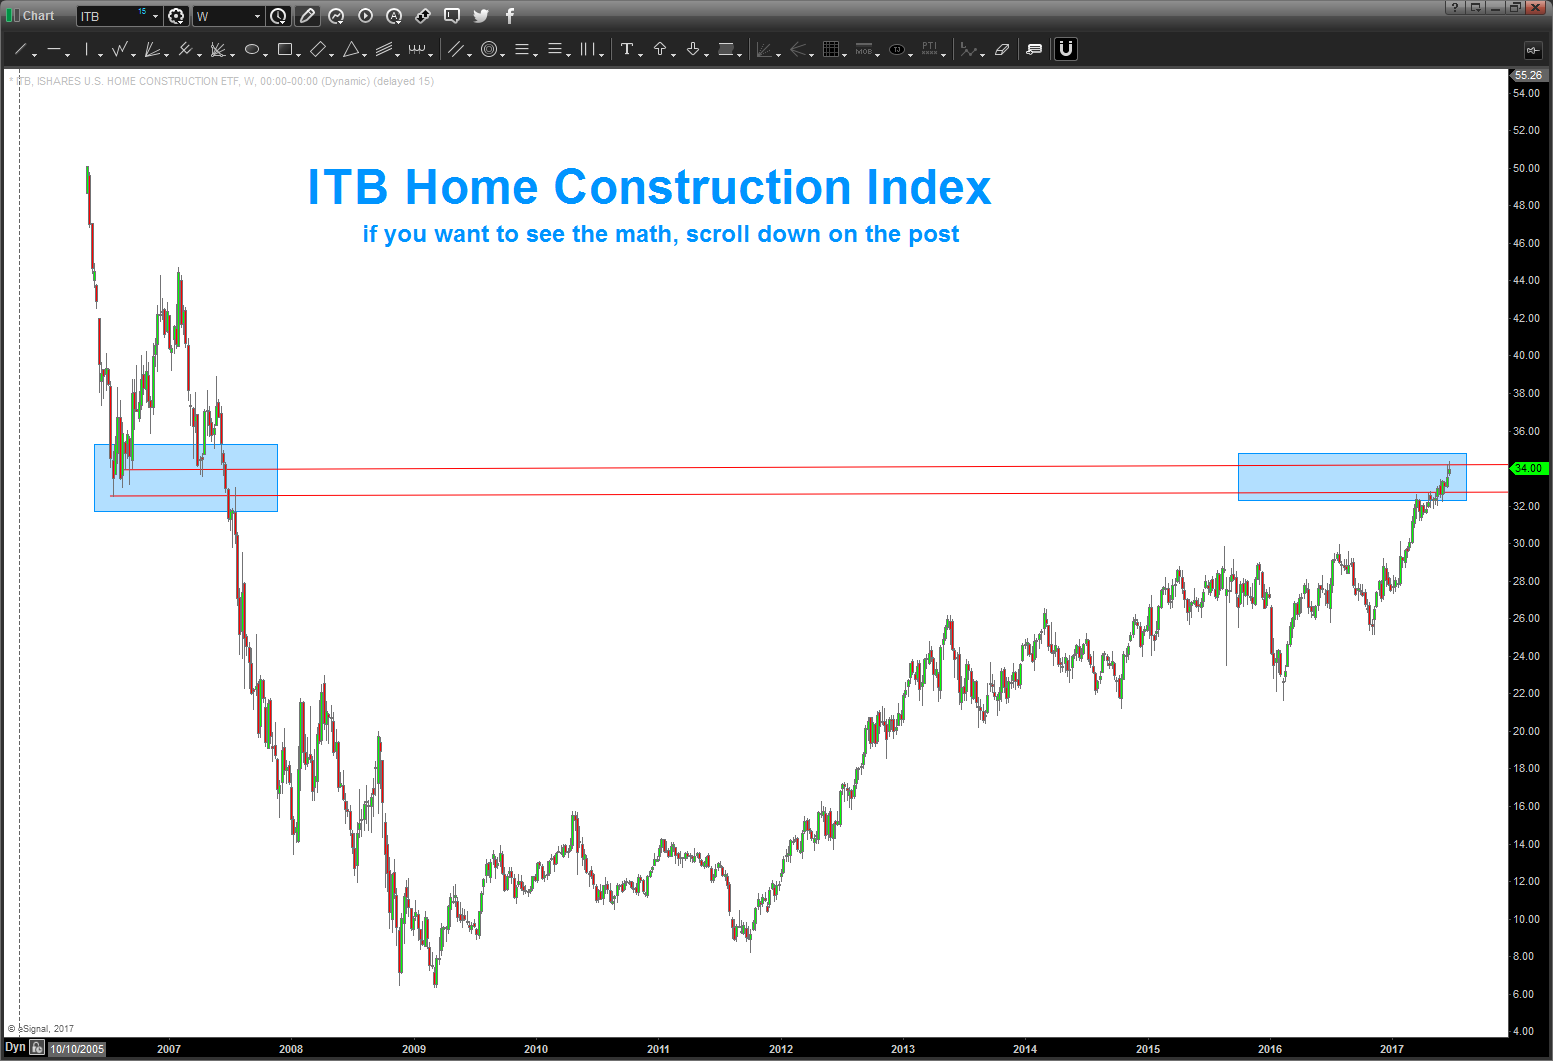
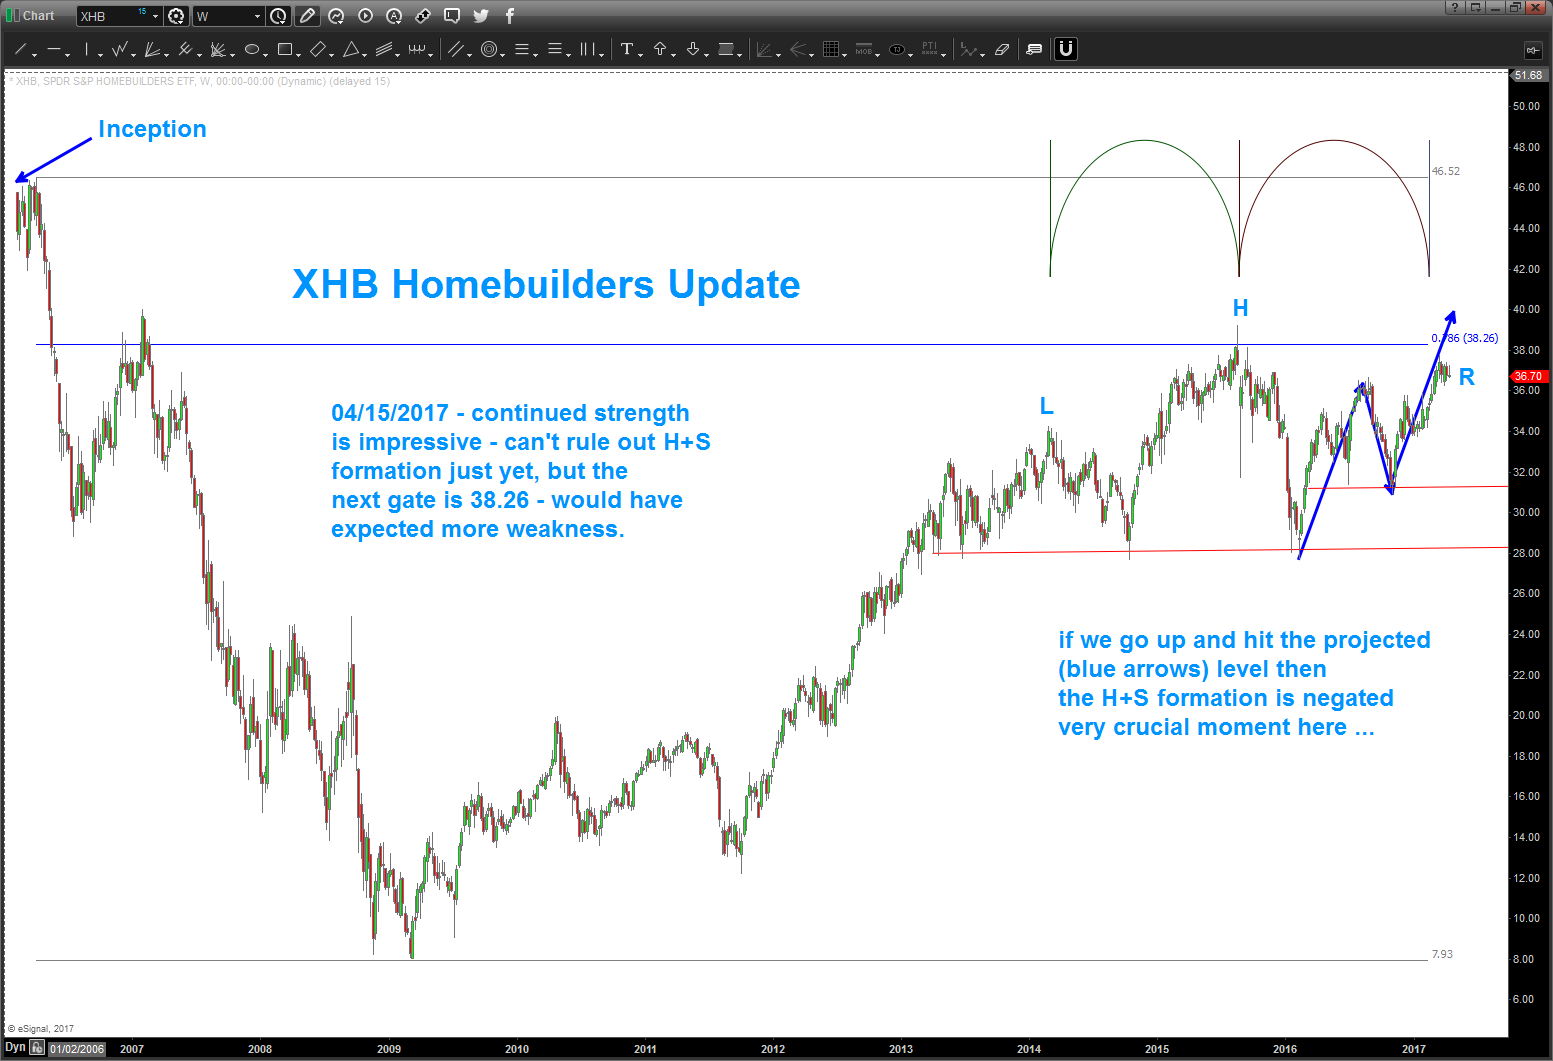
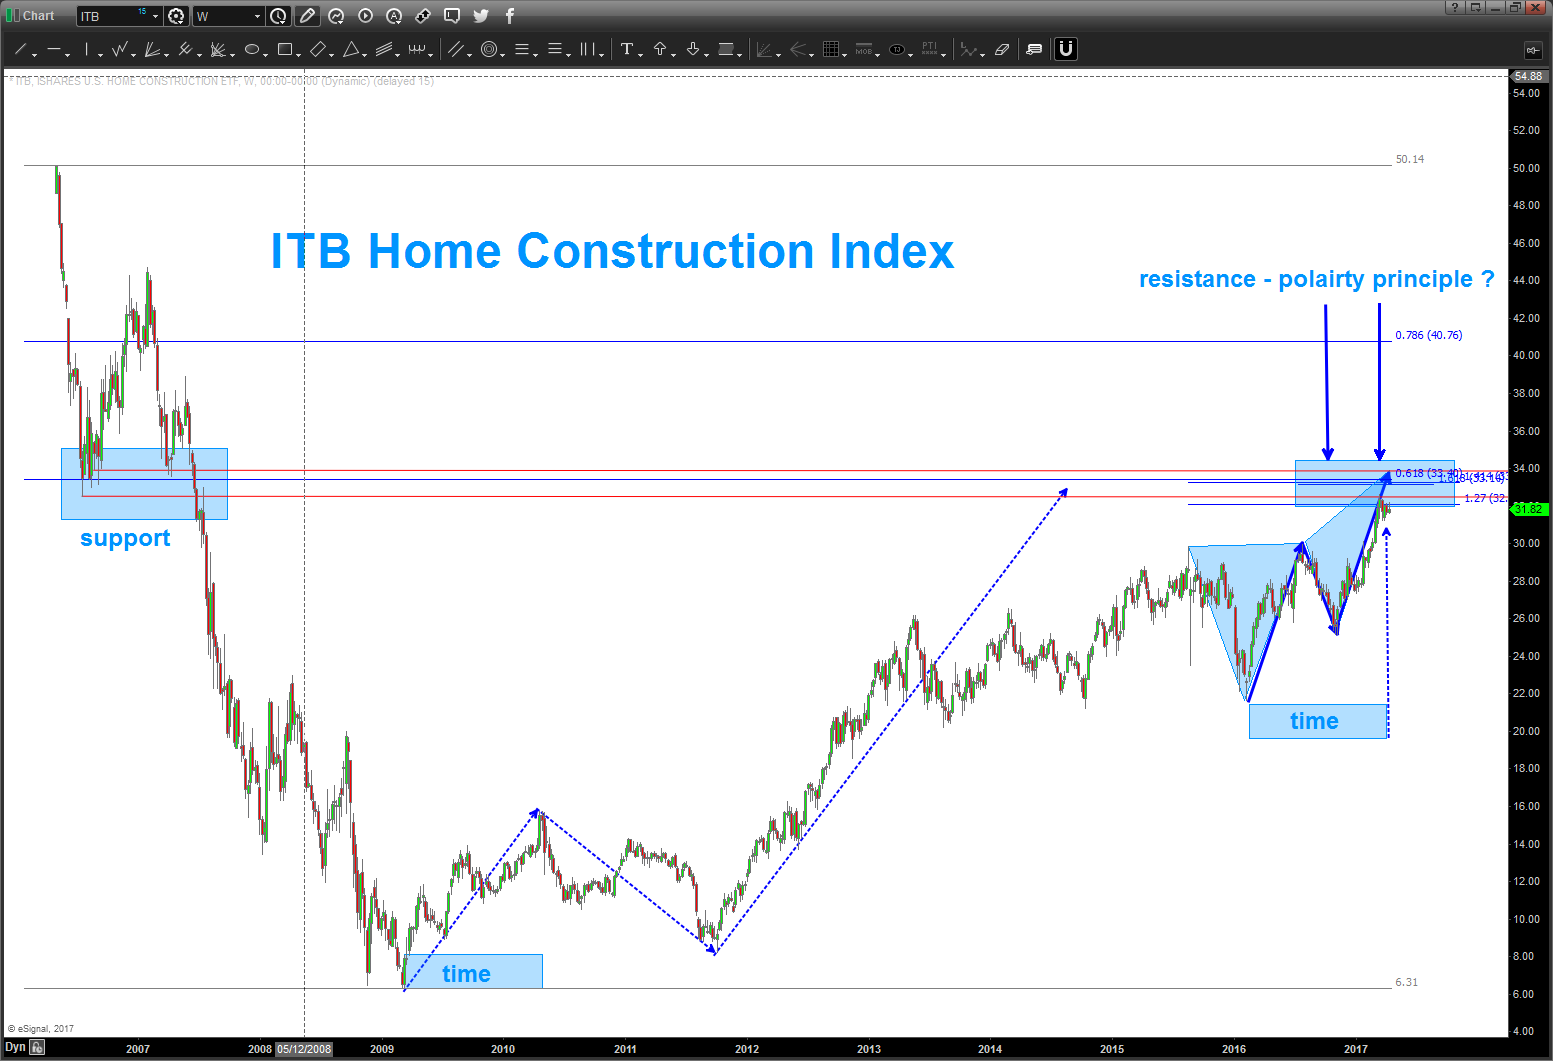
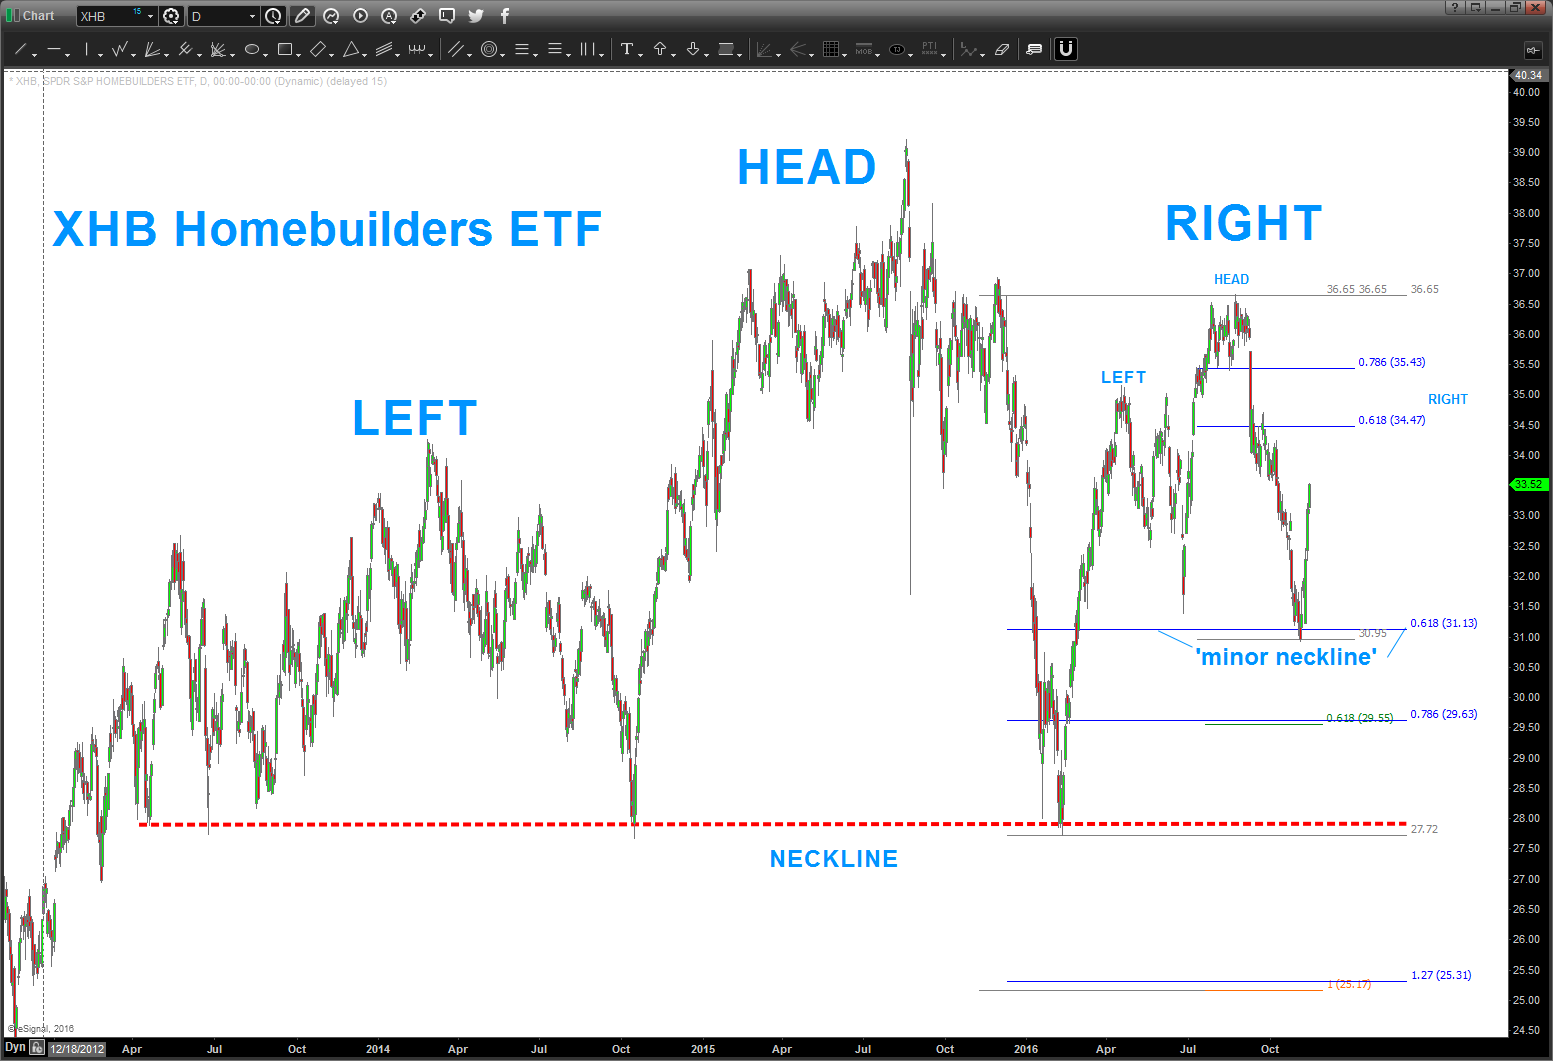
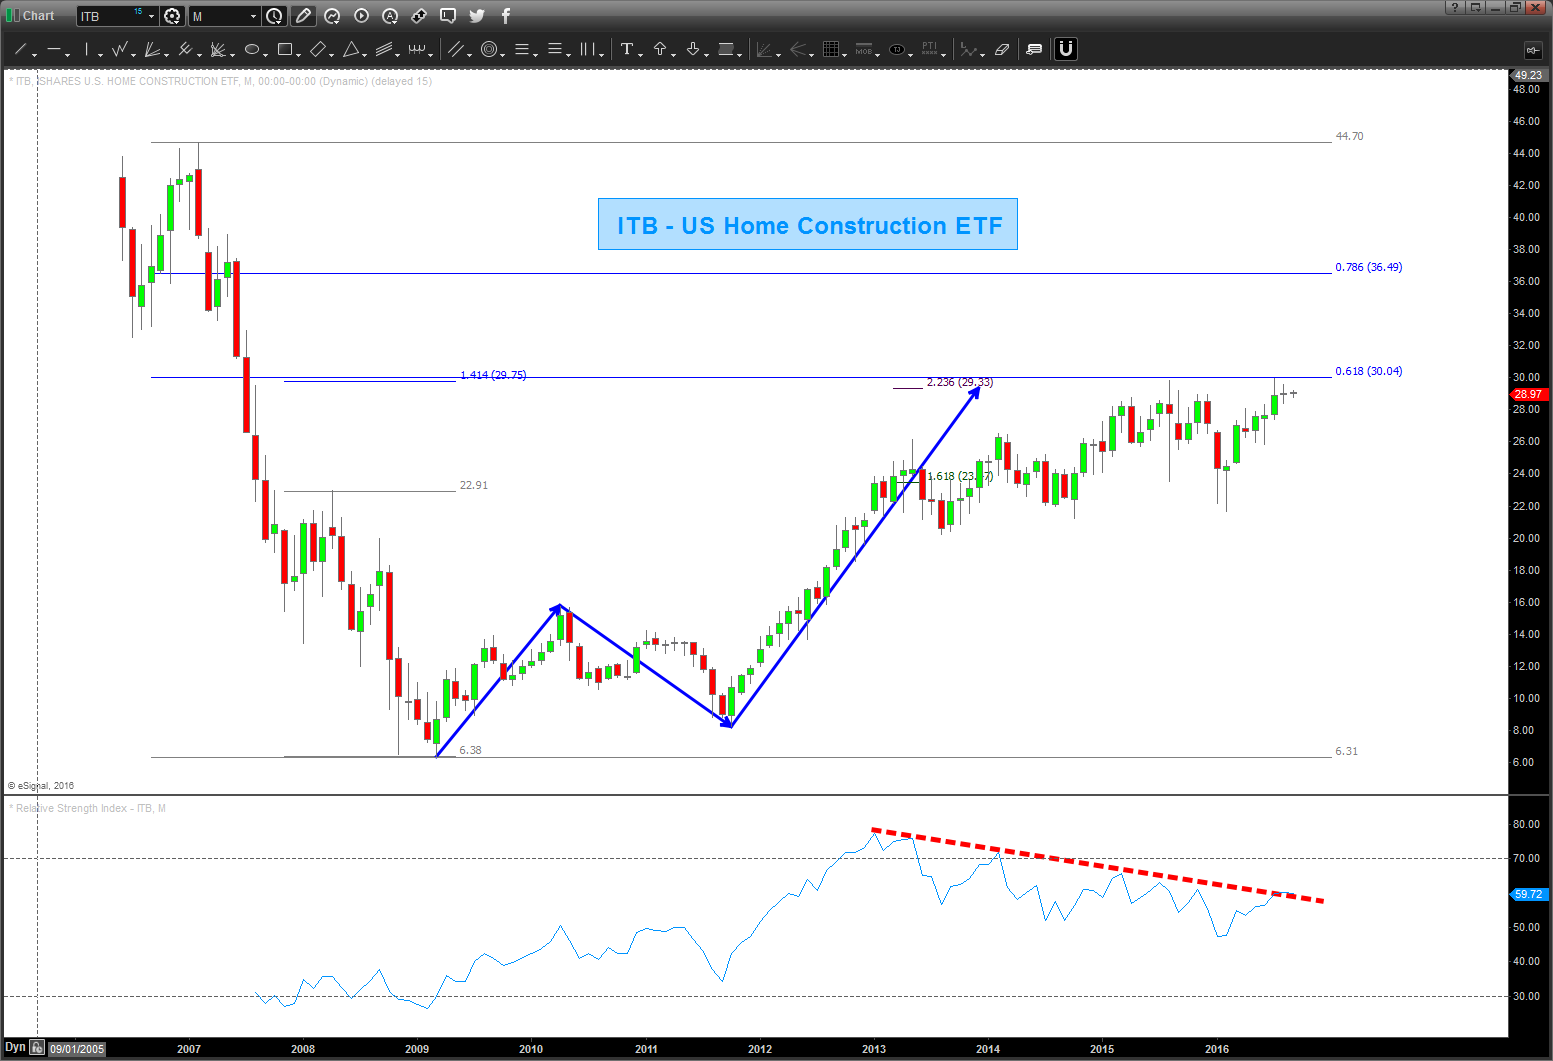
04/15/2017 – XHB has continued higher. It hasn’t made new highs but it sure isn’t showing the weakness that the rest of the overall market is showing right now …I’ve also updated ITB. Note, I didn’t have all the data (not sure why) the last time I posted on this one … the high is in/around 50.
I see strong resistance for XHB and ITB in the coming days/weeks .. I also see 900,000 – 1MM dollar houses in San Diego that are standing inventory all over the place… something will figure itself out, I do know that.
_______________________________________________________________________________________________
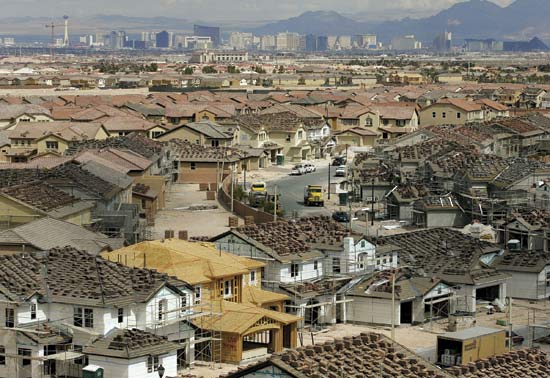
1/30/2017 – TON of standing inventory in the 900,000 range for .00004 acres and <2000 sq ft w/ rates rising. (I know that’s fundamental ‘stuff’ but it helps cast a picture)
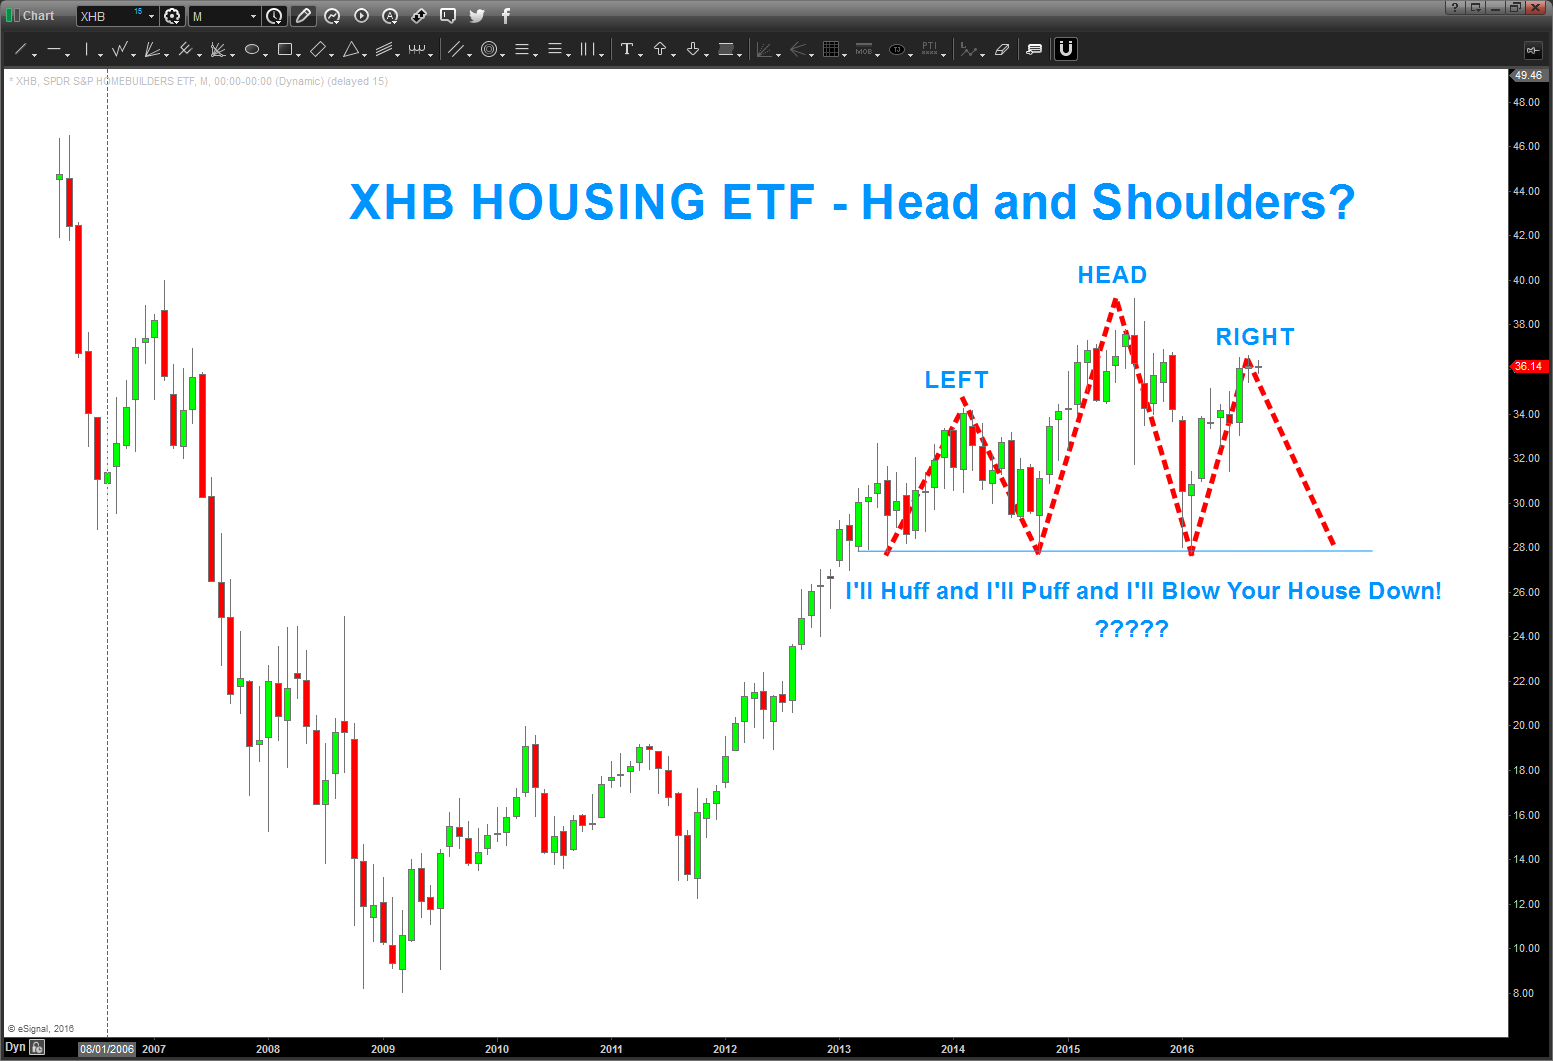
a ‘basic’ H+S on the Home-builders sure seems to be building … only ‘TIME’ will tell. note the ‘time’ symmetry between the L and R shoulders. Kind of cool.
be well, do good.
Bart
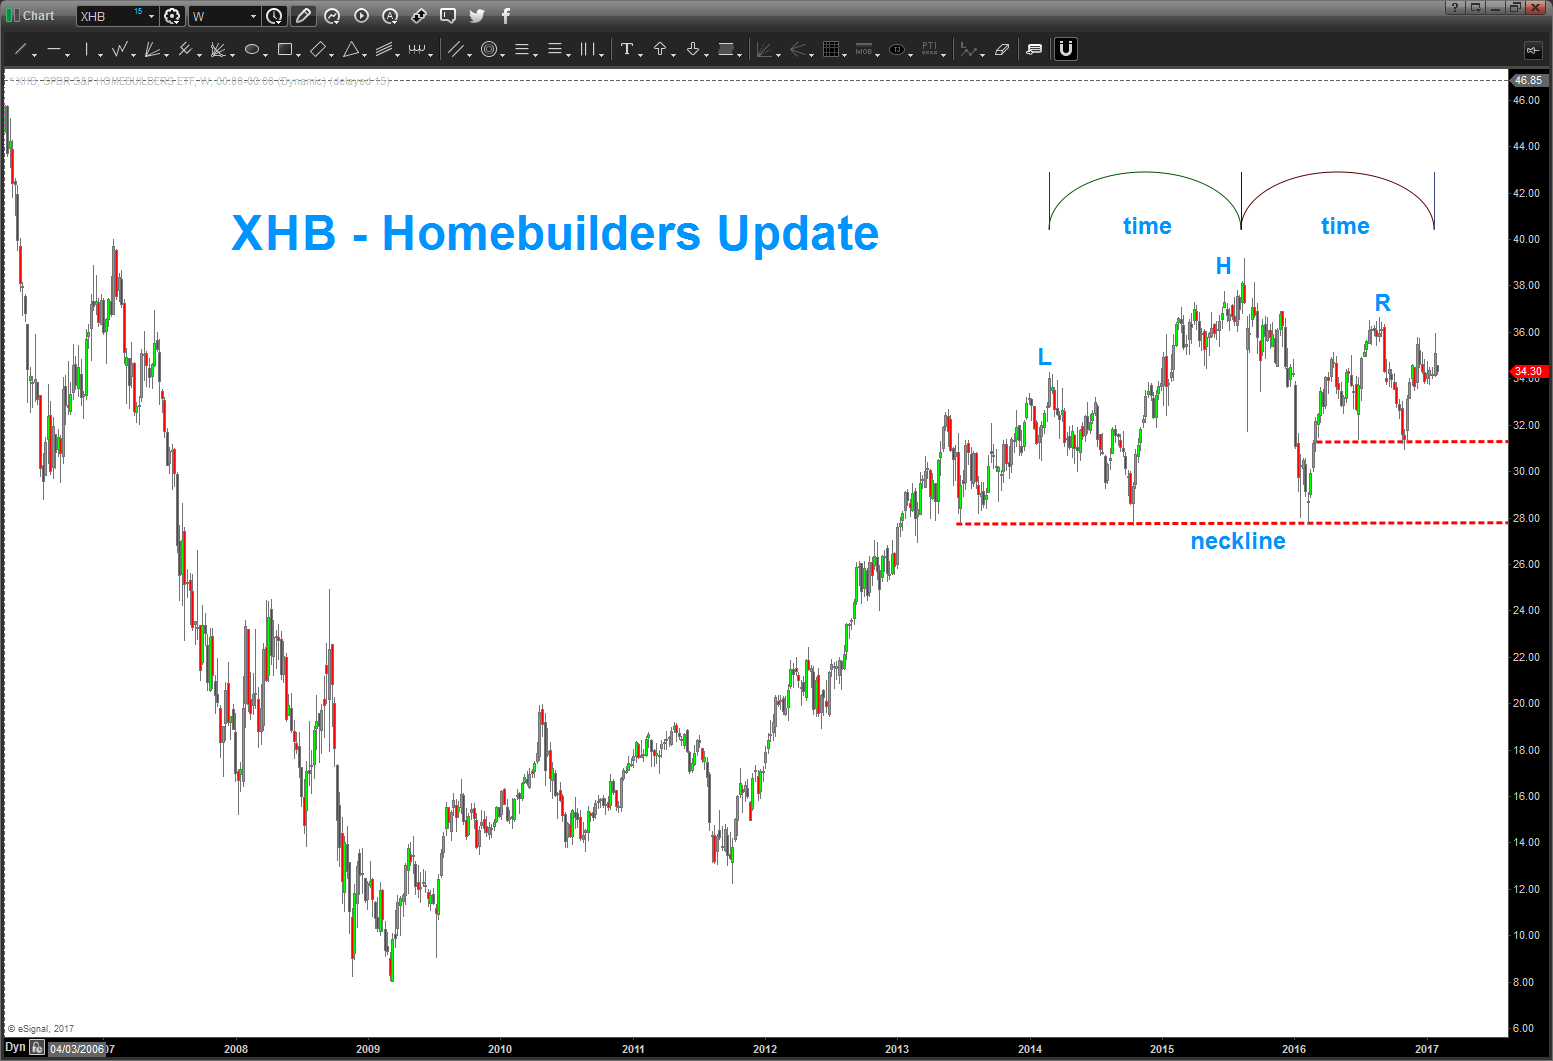
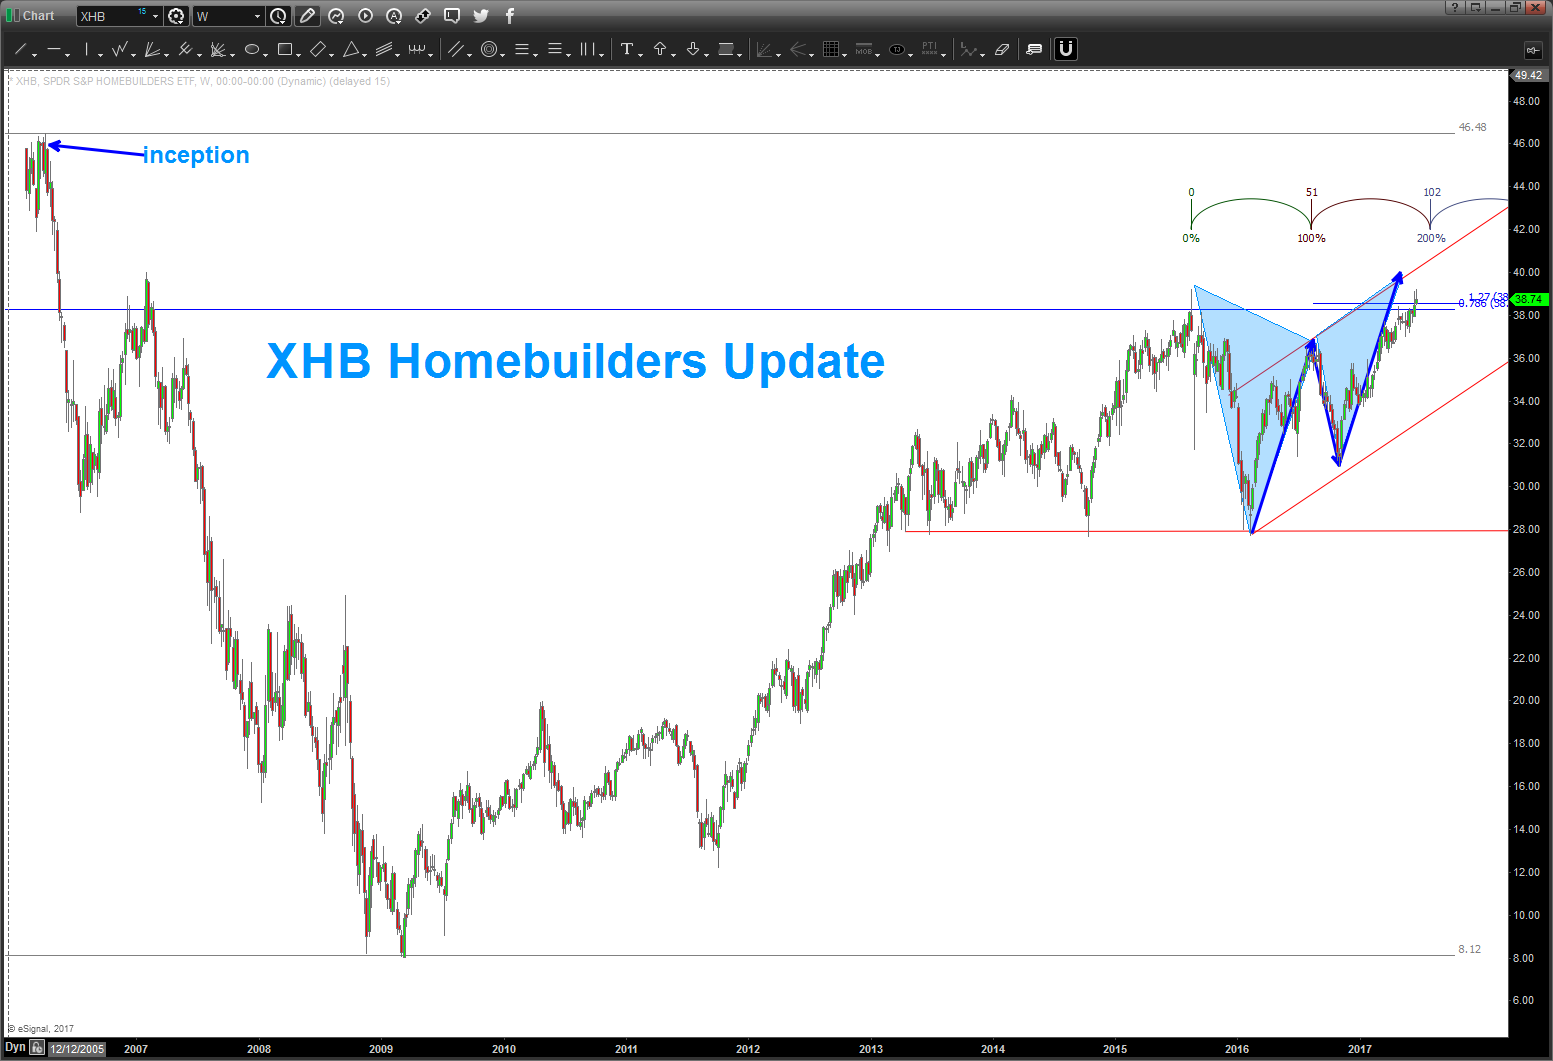
11/14/2016 – since the Election, the XHB ETF has taken off like a rocket ship. You can see below that it hit the .618 retracement from the Spring low of 16′. Upper targets are being shown in around 34-35.
were still working w/ the thesis that the 39 level was the completion of a major sell signal for the homebuilders. This straight up action of late is something to watch closely for this thesis to hold.
of note, a friend of mine sent me this headline:
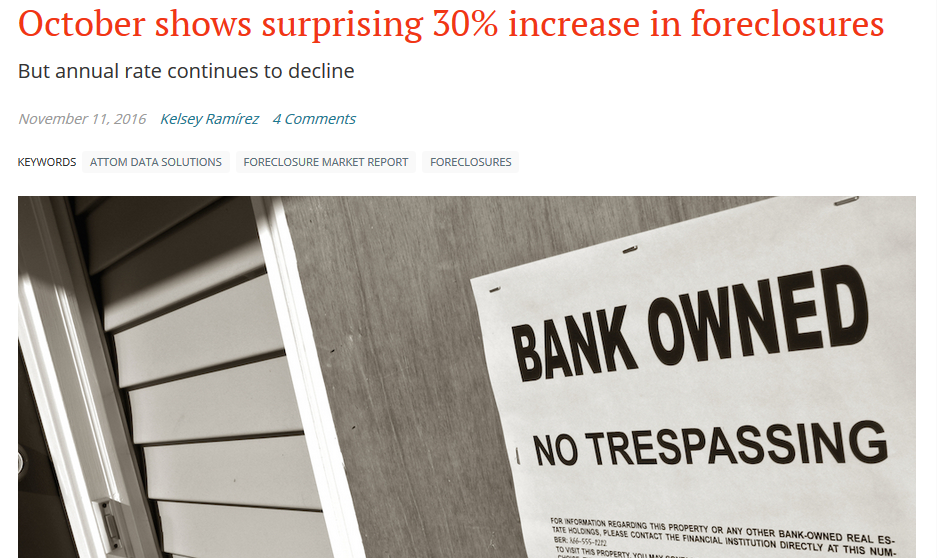
the rise in foreclosures last month was the highest since the big crash. Something to note .. however, the annual rate is still declining. Is this a divergence forming and a potential inflection point? I don’t know … but price/time will tell us.
Bonds are getting smoked of late causing rates to rise …
For those who have followed me you know that I’m usually ‘first to the party’ and ‘see’ things months if not a year in advance. that’s what patterns tell you … i’m not trying to put any spin on this folks. We are at ZIRP, I have houses all over the place going into standing inventory status, rates are rising and we just had a ‘big’ increase in foreclosures last month. Remember – almost a year before anyone paid attention to the Chinese Yuan I saw the BIG JUMP and said … this is something to notice. (https://bartscharts.com/2014/12/06/most-important-chart-to-end-2014/)
So, that’s all I’m doing again ….
Also, take notice of the big time SELL PATTERN FAILURE on the Banking Index. Multi-level chess game going on right now … trust the patterns and they will all line up. That I know …
Do well, be good and rock on, always.
Bart

I sold my house in VA and moved out to SoCal to rent .. did it for a number of reasons. The NUMBER 1 reason was to learn how to Stand Up Paddle-board Surf and enjoy the weather. YES, I understand it’s financial suicide out here .. the taxes are crazy, the cost of living is crazy but the surf is good man …
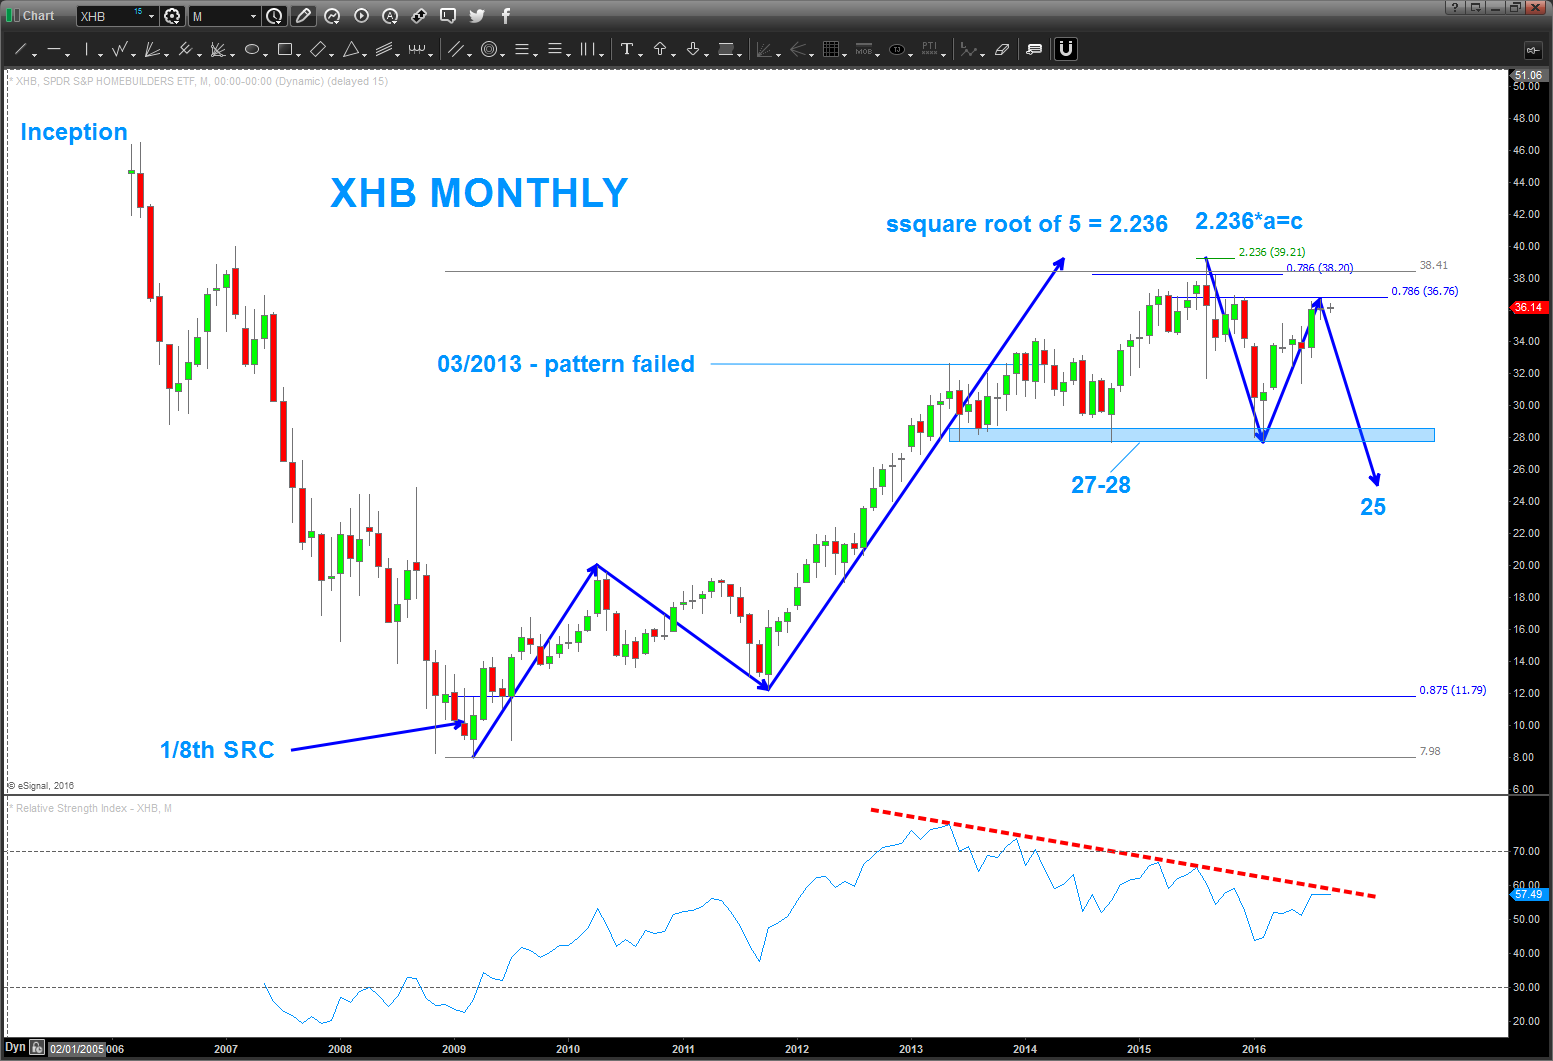
I was SO HAPPY to unload the house … why? Well, I think we are on the verge of another big old smack down in housing. Of note, my post from March 2013 (yes, 3+ years ago that the home builders had topped in/around 32 did not come to fruition. In essence the pattern failed .. so, it went up to the .786 and also completed the 1/8th signal reversal candle. Now, we’ve rallied right back up to the .786 level and are at the demarcation point.
Study:
- this ETF doesn’t want to go below 27. Big support …
- also, note the AB-CD projection down to 25.40 – if we crack from here expect support there and if BULLISH this will hold and bring it to new highs. If it fails … watch out below.
- THOSE are the levels to watch …
- sure looks like a MONTHLY H&S pattern for this ETF … doesn’t it?
To finish the story about San Diego … I was driving around the other day and noticed TONS of standing inventory …plus the houses were selling for 850K to 1.0 + MM. Folks, that dog don’t hunt man …
Also, the PATTERNS suggest a MAJOR top in bonds which means higher rates … so, it’s been 3+ years since my last post on home builders. It’s moved, a little, perhaps it will move more, but man this sure looks like a BIG top is coming in housing ….
Here’s the Home Construction and Home Builders ETF (ITB and EHF)
Again, folks, it’s just PATTERNS. Sometimes they work, sometimes they don’t … but at least we have some guides to support what could (could being the operative word) a BIG OLD THUMP in housing …
Bart
