3 Comments on “$EMKR – the longer the base the higher the run!”
Hi Bart,
Pretty interesting, this ” longer the base the Higher the run” business. AAPL is a fine example of this thinking. One thing I always wonder about is if there is a way to
quantify the real breakout point for these bases ? I see the obvious high volume spike
and was wondering if you feel this point marked “the signal” for a move out of the base
and the following action perhaps the start of an actual move and not just more base
building ?
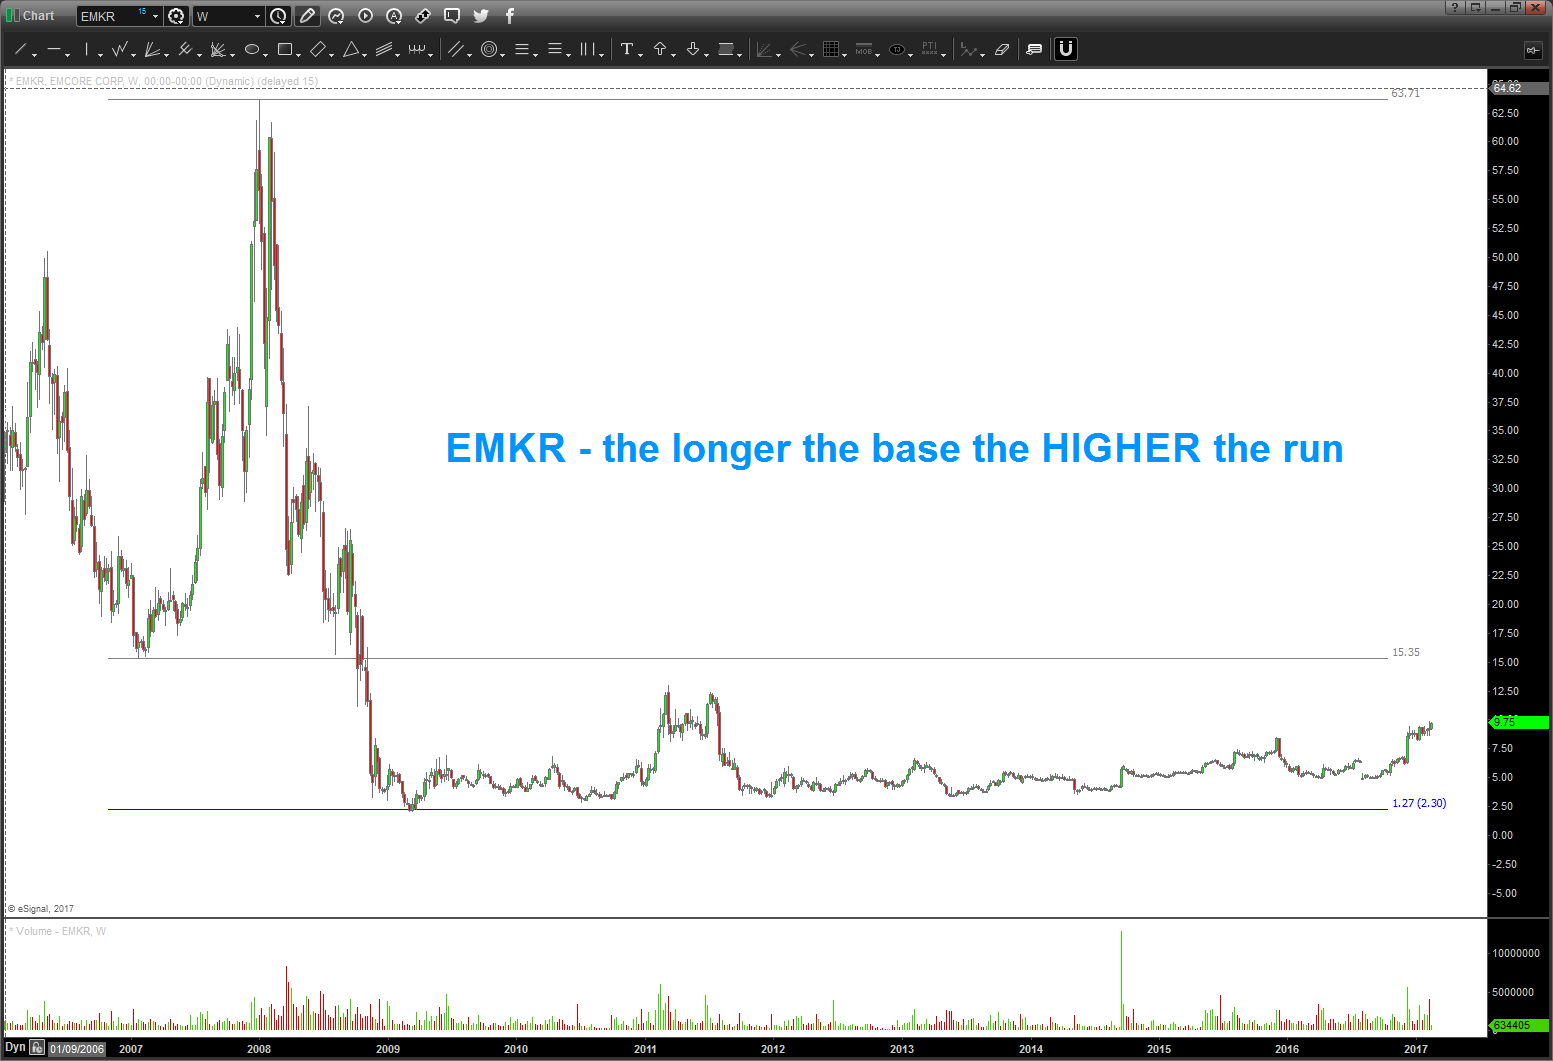
Jeff, great questions. What I like to do is draw a horizontal range, in this case 12-13 bucks and look for a WEEKLY or MONTHLY close above this level. The “perfect” gameplan would be for the stock to roll up to the 15.35 resistance zone (2007 and 2008 former support) and then fall back and THEN BUY against the 12-13 zone. If you look at the 03/2011-06/2011 you’ll see how the stock went up (12/2015) hit that zone, fell, then broke thru only to COME BACK in an “OUTSIDE RETURN” at 7.50 and is now taking off …does that make sense?
Certainly does !
Also noticed if you take the possible breakout range of 13 – 1.21, double it and
adding to the low of 1.21 you get an almost exact 38.2 retracement of the bigger
move from 63.5 down to the low @ 1.21. Might add some further evidence of
a valid range break going to a measured target move.

Hi Bart,
Pretty interesting, this ” longer the base the Higher the run” business. AAPL is a fine example of this thinking. One thing I always wonder about is if there is a way to
quantify the real breakout point for these bases ? I see the obvious high volume spike
and was wondering if you feel this point marked “the signal” for a move out of the base
and the following action perhaps the start of an actual move and not just more base
building ?
Always appreciate your thinking.
Jeff
Jeff, great questions. What I like to do is draw a horizontal range, in this case 12-13 bucks and look for a WEEKLY or MONTHLY close above this level. The “perfect” gameplan would be for the stock to roll up to the 15.35 resistance zone (2007 and 2008 former support) and then fall back and THEN BUY against the 12-13 zone. If you look at the 03/2011-06/2011 you’ll see how the stock went up (12/2015) hit that zone, fell, then broke thru only to COME BACK in an “OUTSIDE RETURN” at 7.50 and is now taking off …does that make sense?
Certainly does !
Also noticed if you take the possible breakout range of 13 – 1.21, double it and
adding to the low of 1.21 you get an almost exact 38.2 retracement of the bigger
move from 63.5 down to the low @ 1.21. Might add some further evidence of
a valid range break going to a measured target move.