Home Depot Rocketship …. $HD the math stopped it, for now (?)
08/20/2016 – I did a talk for the MTA, a while ago, and I called it “musical polarity.” while the polarity principle is, in and of itself a KEY and POWERFUL technical analysis tool, many of us only use “horizontal” support and resistance to look for overhead supply (fundamental term) and stuff like that.
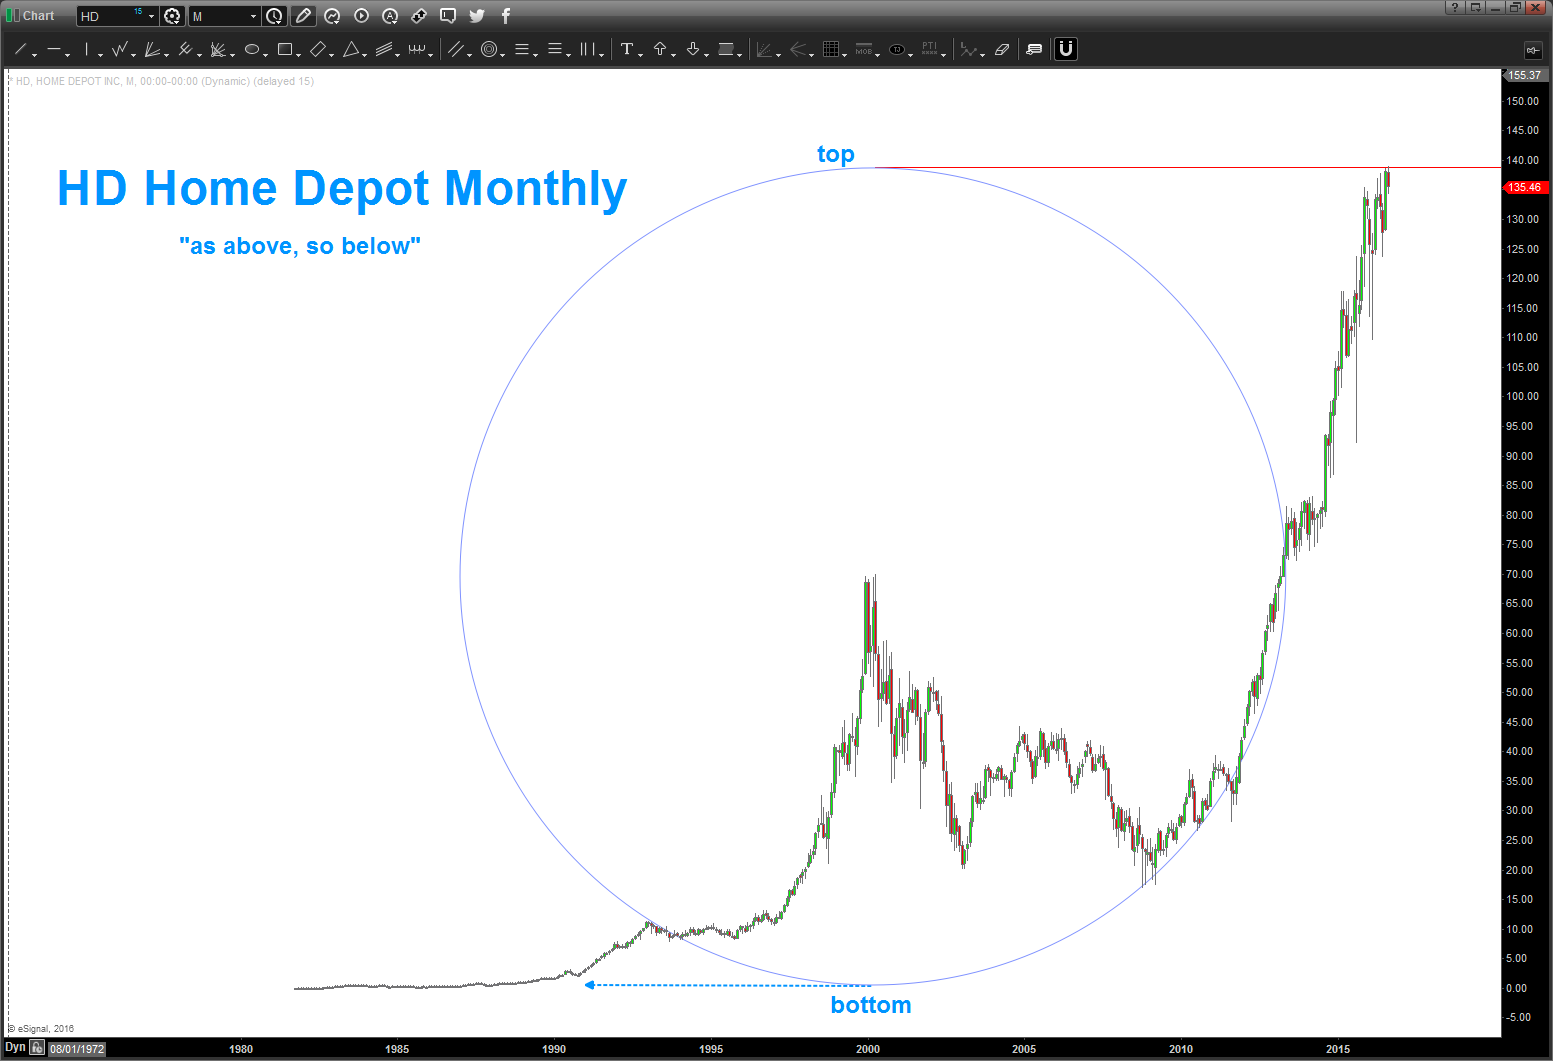
if we orient our polarity view to the natural plane of the chart (x,y) axis then some very powerful techniques are unleashed. in this case, the concept of support at the bottom of a circle drawn w/in the plane of the largest correction on the chart diameter will lead to resistance at the top of the circle.
the “ancients” were extremely intelligent people who used geometry to explain everything .. they used, almost exclusively, the circle, the square and the angles emminating from them to teach advance concepts on the nature of nature. (that sounded cool)
so, IF everything is vibration (I believe to the core of my being it is) THEN the energy vectors along the plane of the circle (x,y and yes z) hold a special place, so to speak.
so, I have ZERO idea if this is “a” top of HD or not. and, I really could give a shit …just showing you that HD hit a top of THE circle defining it’s move.
- If your a fundamentalist – congratulations that makes you really smart – then just delete this like you do all “voo doo” charts. No skin off my back…
- If your a typical technician, you’ll NEVER see this type of geometry because you have 50,000 indicators on your chart (which obtw are probably all LAGGING price/time) so clear your screen and just chill and let the chart speak to you …
- If your a “chartist” then grab your crayons and protractors and STUDY the patterns that are present on the charts and do the work .. the math is there.
If your looking to make money on shorting HD THEN this entire philosophical diatribe is dead wrong w/ a WEEKLY close above the top of the circle …
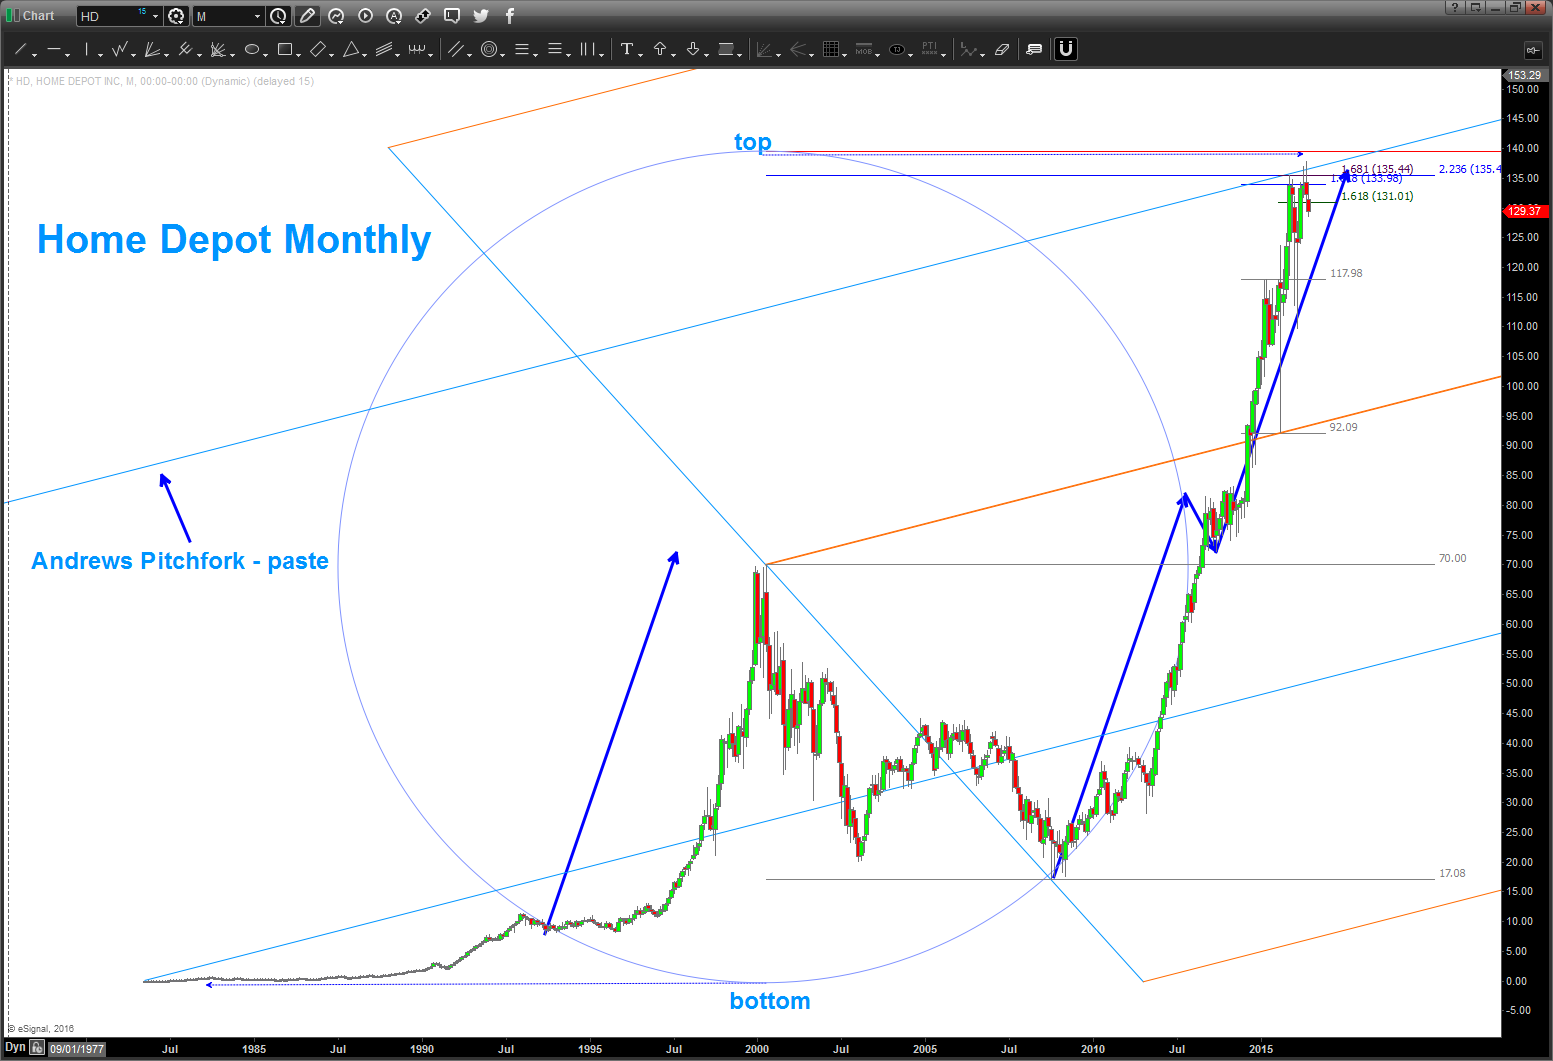
06/09/2016 – so, the top of the circle and the math appears to have worked on targets for HD.
- again, have ZERO idea about the fundamentals
- just drew a circle w/ the radius equal to the biggest corrective move in it’s history
- obtw, the bottom of the circle is support in/around zero price so the top of the circle
- the blue arrows are the “measured moves” of HD throughout it’s history
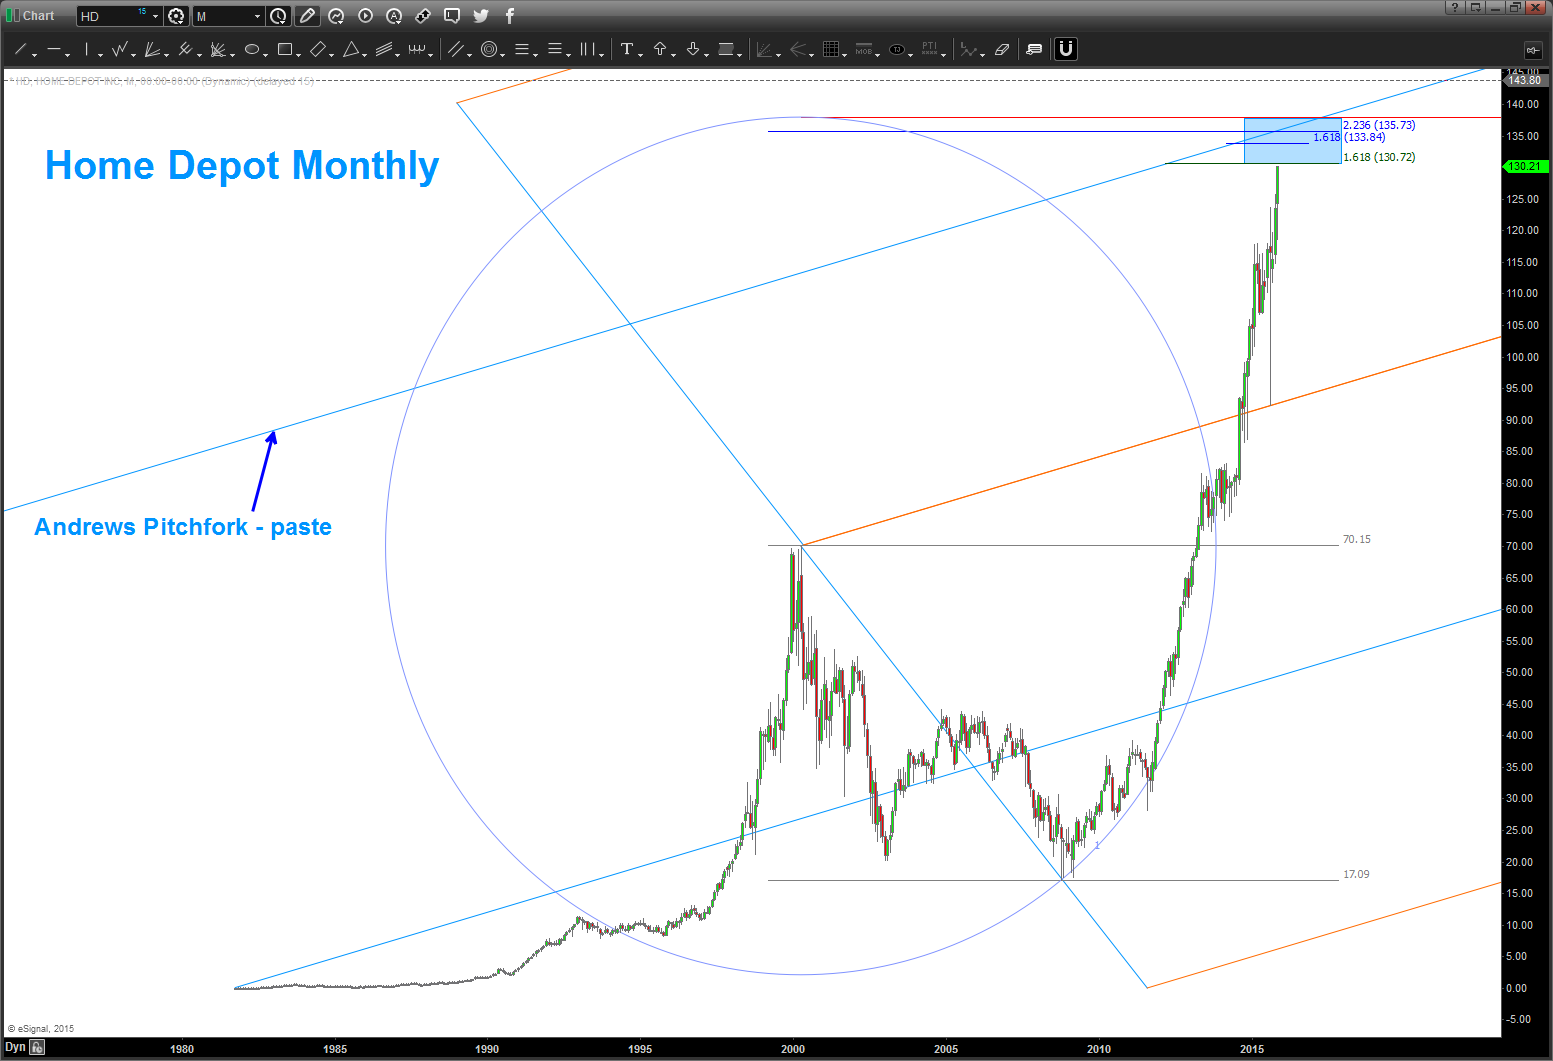
- the “geometry” of the Adams Pitchfork from the IPO and all time low was simply copy/pasted and the median line stopped the rise in it’s track
learn to use crayons, it’s much easier than reading a 100 page document on HD and it’s fundamental stuff
believe this could be a significant top for HD …
Well, every other pattern level has been defeated so why not the one’s shown below? We have a bunch of math coming in …130-135.
stay tuned.