DJ Utility Index – important SELL pattern formed/forming. heads up
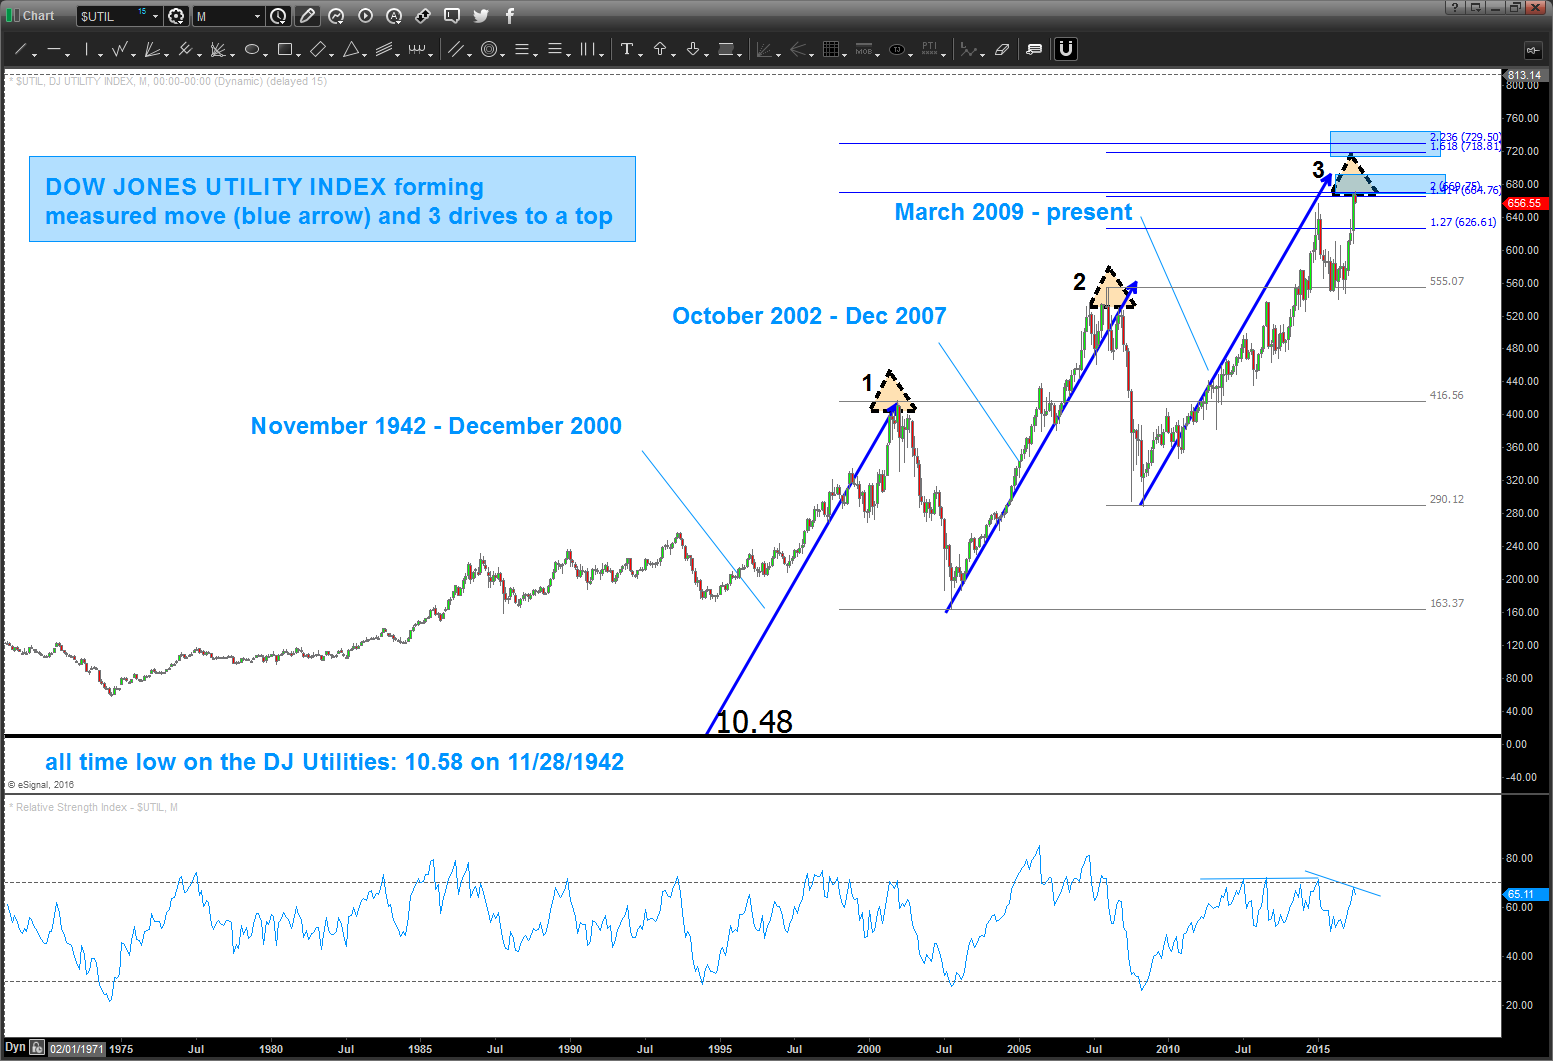
04/05/2016 – as you can see below, the pattern failed on the Dow Jones Utility Index in/around 560-570 and propelled higher.
now, per the chart below, you can see we are at another crucial juncture. the “blue arrow” represents the MAXIMUM that the Utility Index has moved since it’s low in 1942. In around the orange triangle labeled 3 (for the 3 drives to a top) the average should run into MAJOR resistance. this “should” put pressure on the bonds ….also, note the monthly bearish divergence present.
Warning sign, pay attention.
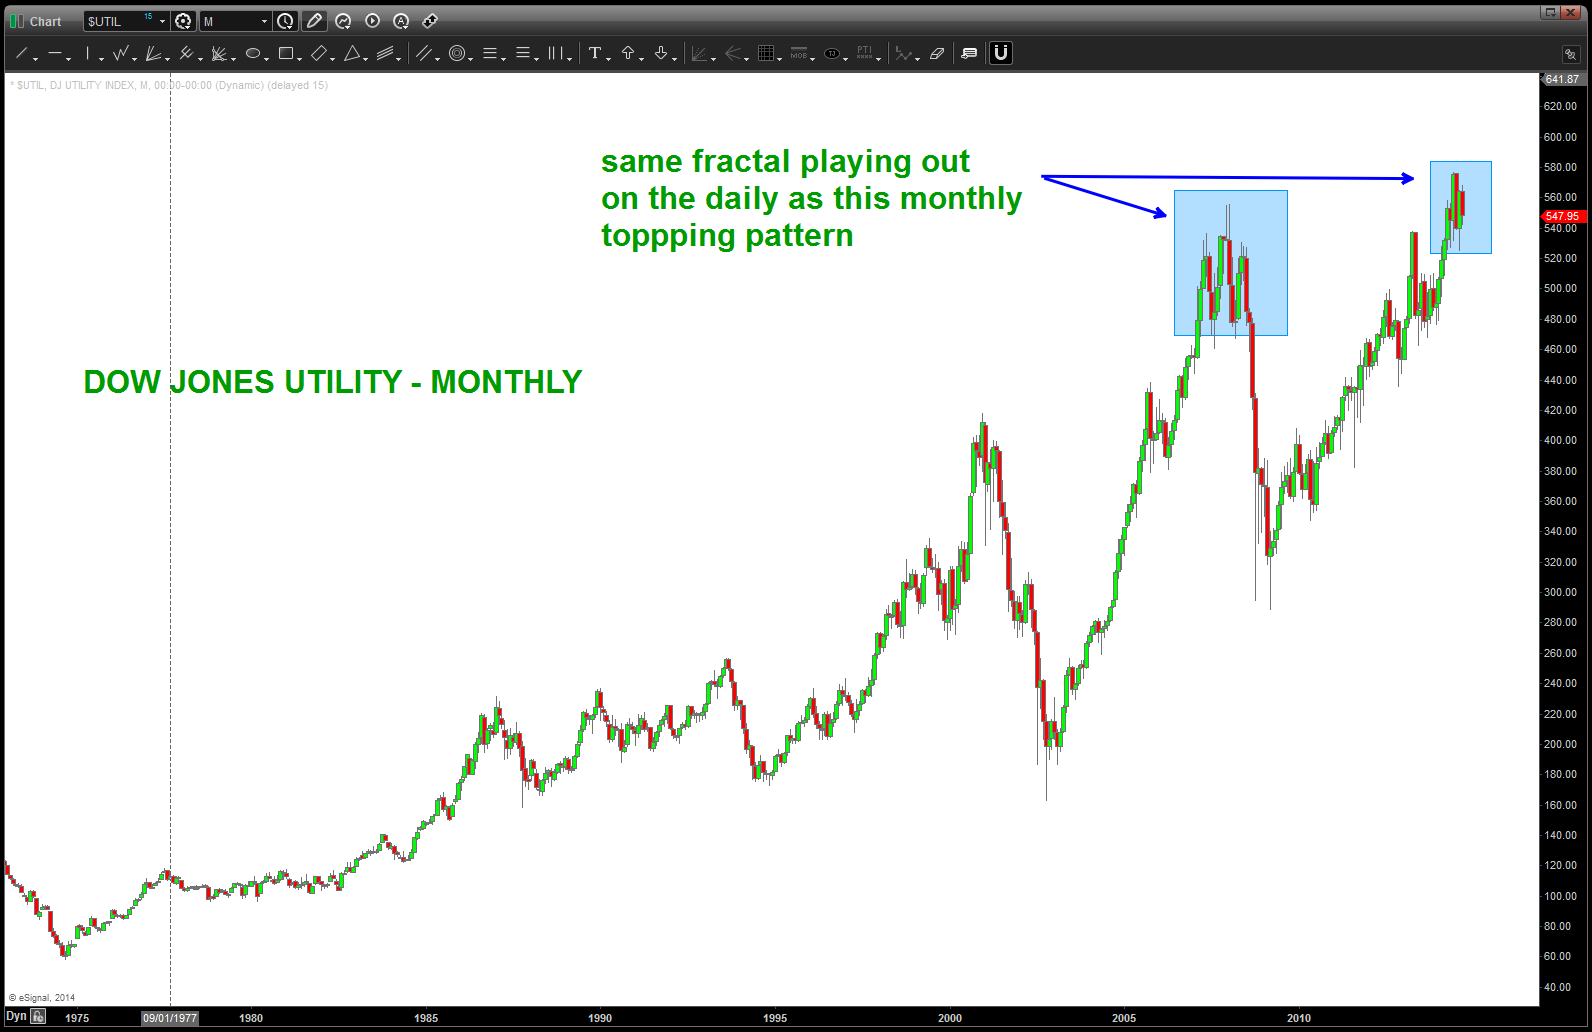
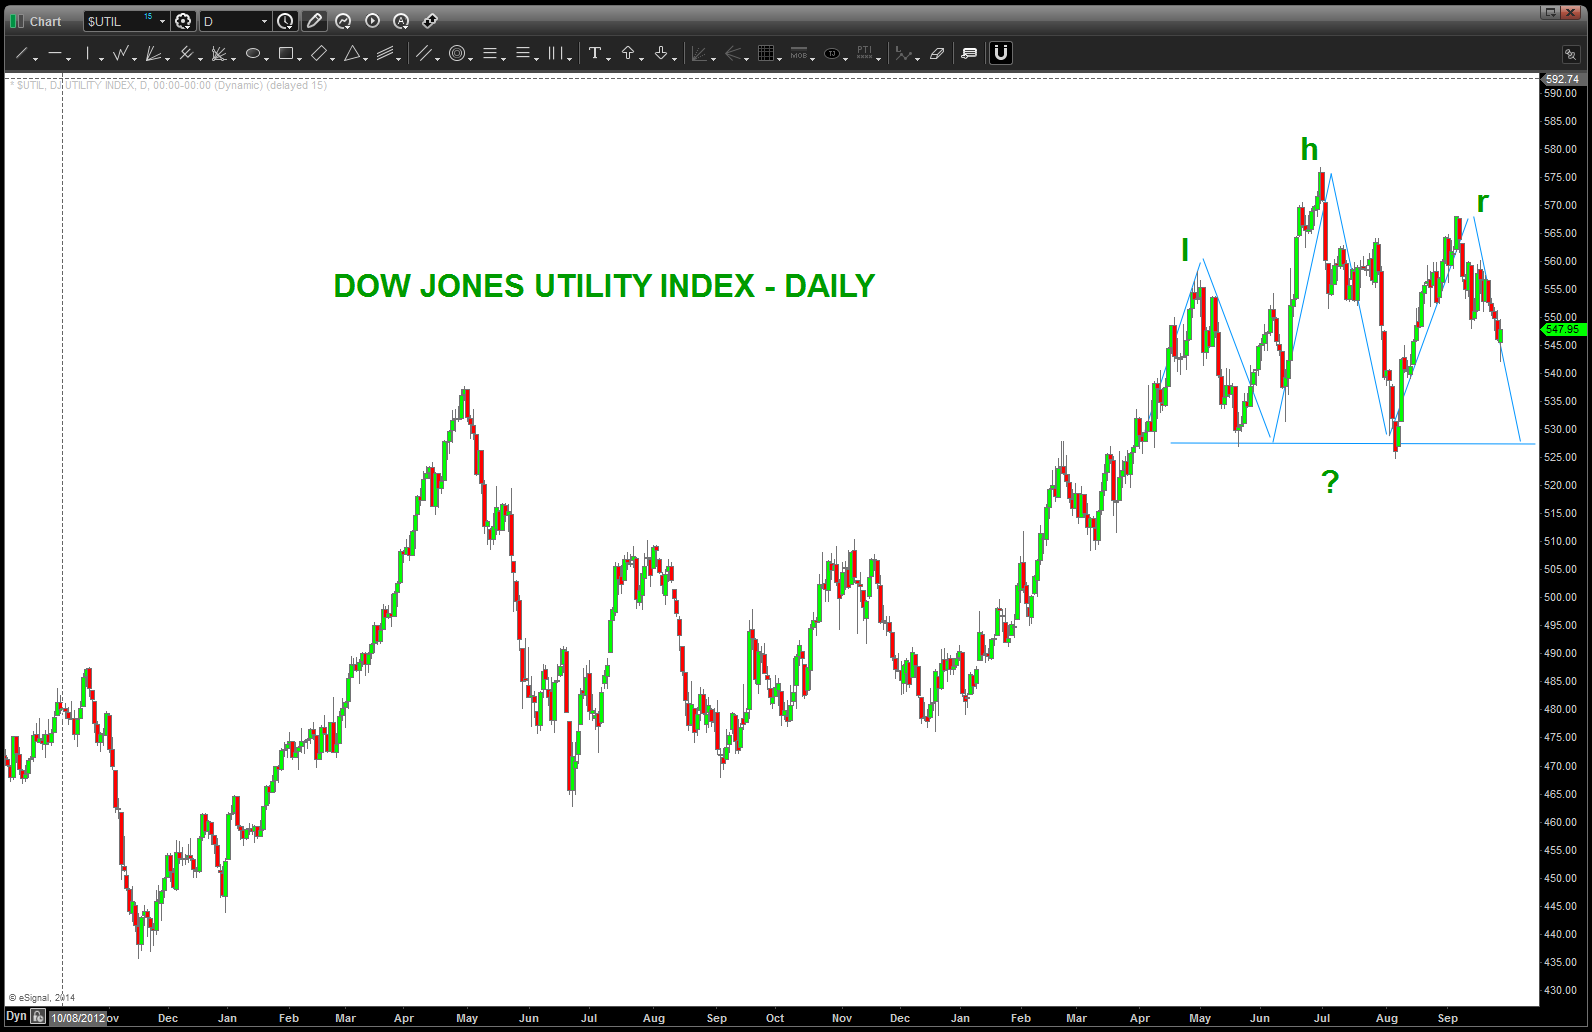
back in April 2014 (https://bartscharts.com/2014/04/19/dow-jones-utilities-long-term-1942-price-pattern/) we ID’d a long term pattern that was completing. the market subsequently went up into Jun/Jul and hit the target. now it appears we “might” be carving out a Head and Shoulders Daily topping pattern. Note, this same pattern came into play on a MONTHLY basis during the 2007-2008 time frame.
the reason we are watching this closely is because of the presence of this long term topping pattern that has hit and held, thus far.