Gold, an update
CONCLUSION: the 3 waves to a new low did NOT turn out to be a “B” wave w/ a big C UP to come. However, I’m still seeing Gold carving out a bottom HERE or a little lower in the coming days/weeks. charts to follow …
the C wave that did not come did show a continual 3 wave structure making new lows … that fits the scenario of an ending diagonal which is 5 waves in nature but each leg is 3 waves. that’s what appears to be happening as of the close today.
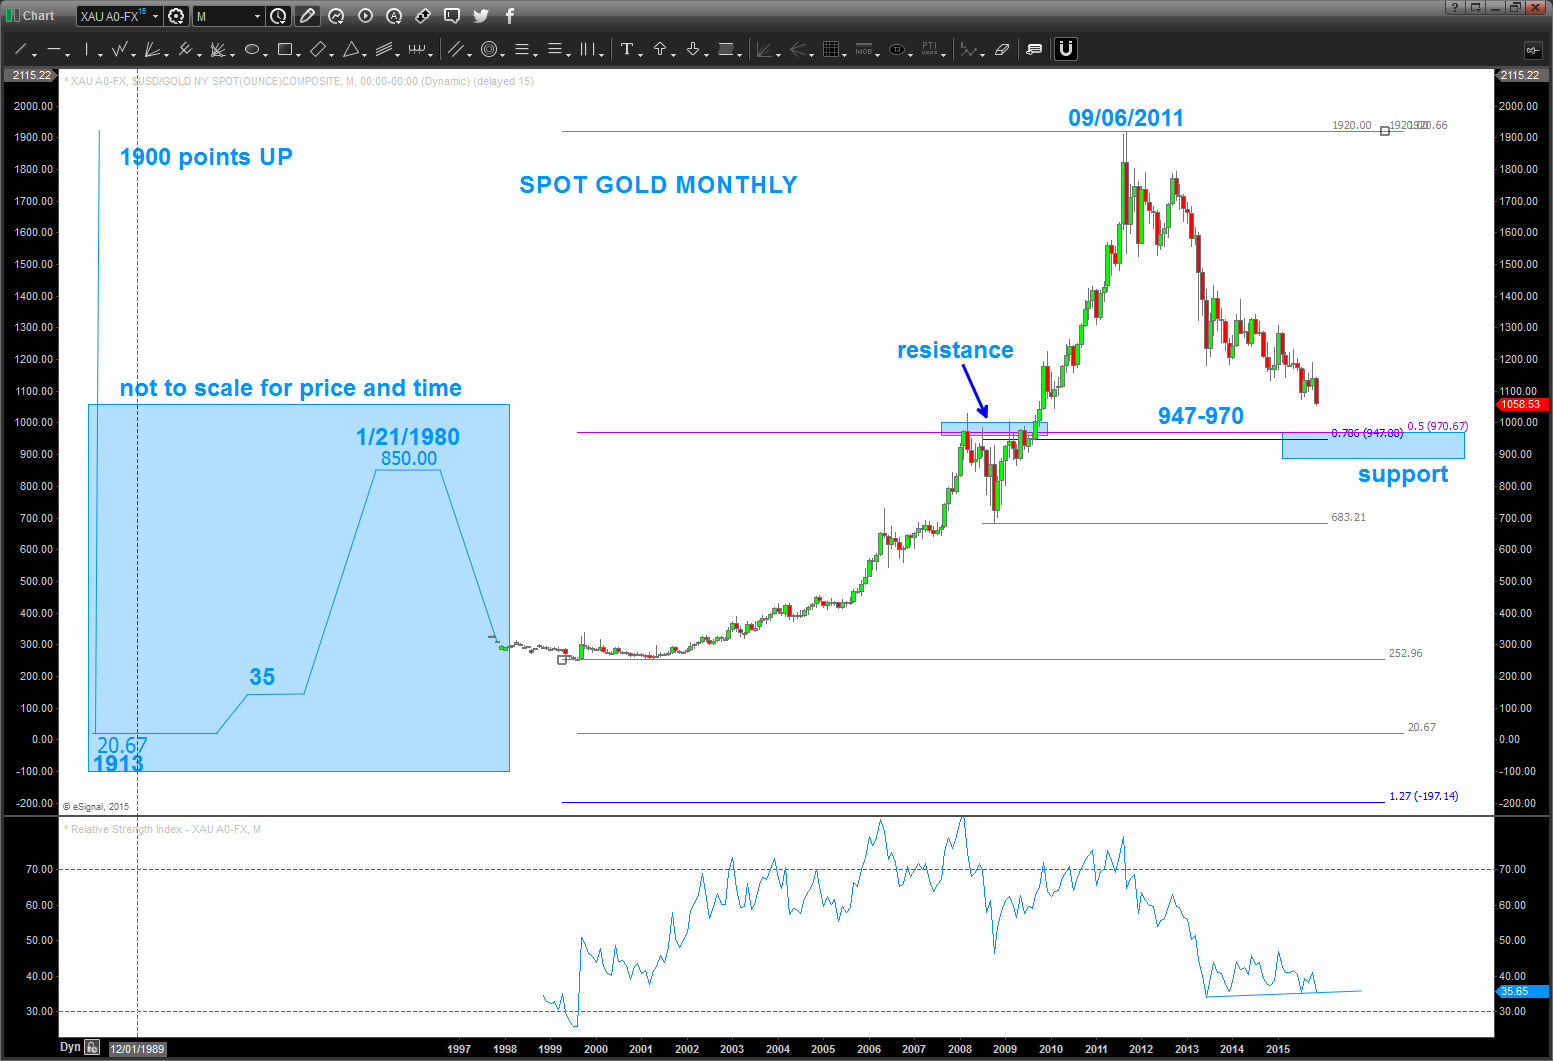
SPOT GOLD MONTHLY:
- note the blue shaded area to the bottom left of the chart
- that shows the fixed price back in 1913 at 20.67.
- That 20.67 “node” was the reason for the bounce at/around 1200 ending wave 3. a 50% retrace of the entire run in gold lies a little low 970. also, note the RSI.
- It’s the lowest it’s been in 14 years and as PRICE makes new lows, the RSI is holding it’s levels. that’s bullish divergence. it certainly could break that shelf and blow off to the bottom but, again, we have “nice” support in/around 947-970
- also, note the the thinner blue rectangle areas w/ resistance and support noted – polarity. the resistance held for 17 months.
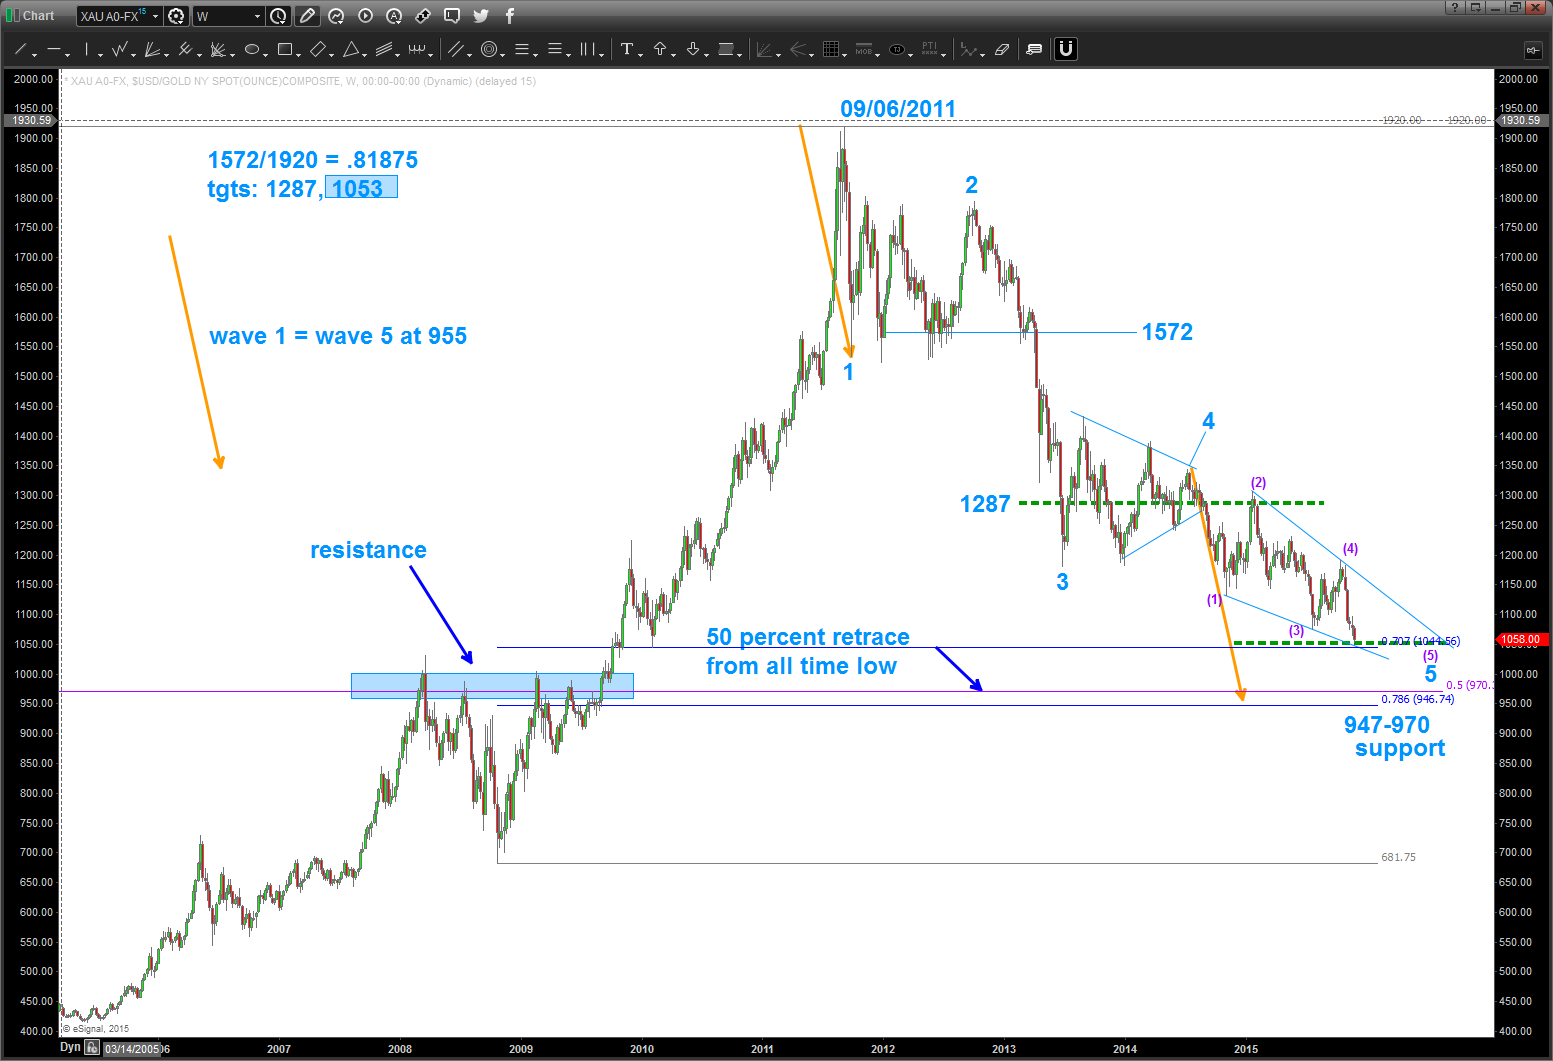
SPOT GOLD WEEKLY
- put the count on that makes the most sense. the BIG caveat to this count was/ is the top at 1920 a 3 or a 5…. really doesn’t matter that much because we are on the right side of the move but it does and will have big picture ramifications. either way, I feel confident that a 5 wave move lower is about to end.
- one of the very powerful price projection target techniques is that of the fundamental frequency. we have that in the upper left corner below. You can see that the 1st FF Tgt was 1287 and that was responsible for the “shucking and jiving” we had at that level before finally breaking. the triangle formed using that level as the center . pretty cool hugh? the next target, that was hit today was 1053
- note, I used 1572 NOT the lower “wick target” at 1 because of the open/closes around that level. so, 1053 might be off a little but I used what i was SEEING for that target.
- one last, to balance and harmonize a move a lot of times wave 1 will equal wave 5 since 3 was so extended and powerful. Those orange arrows come right into the 946-970 level.
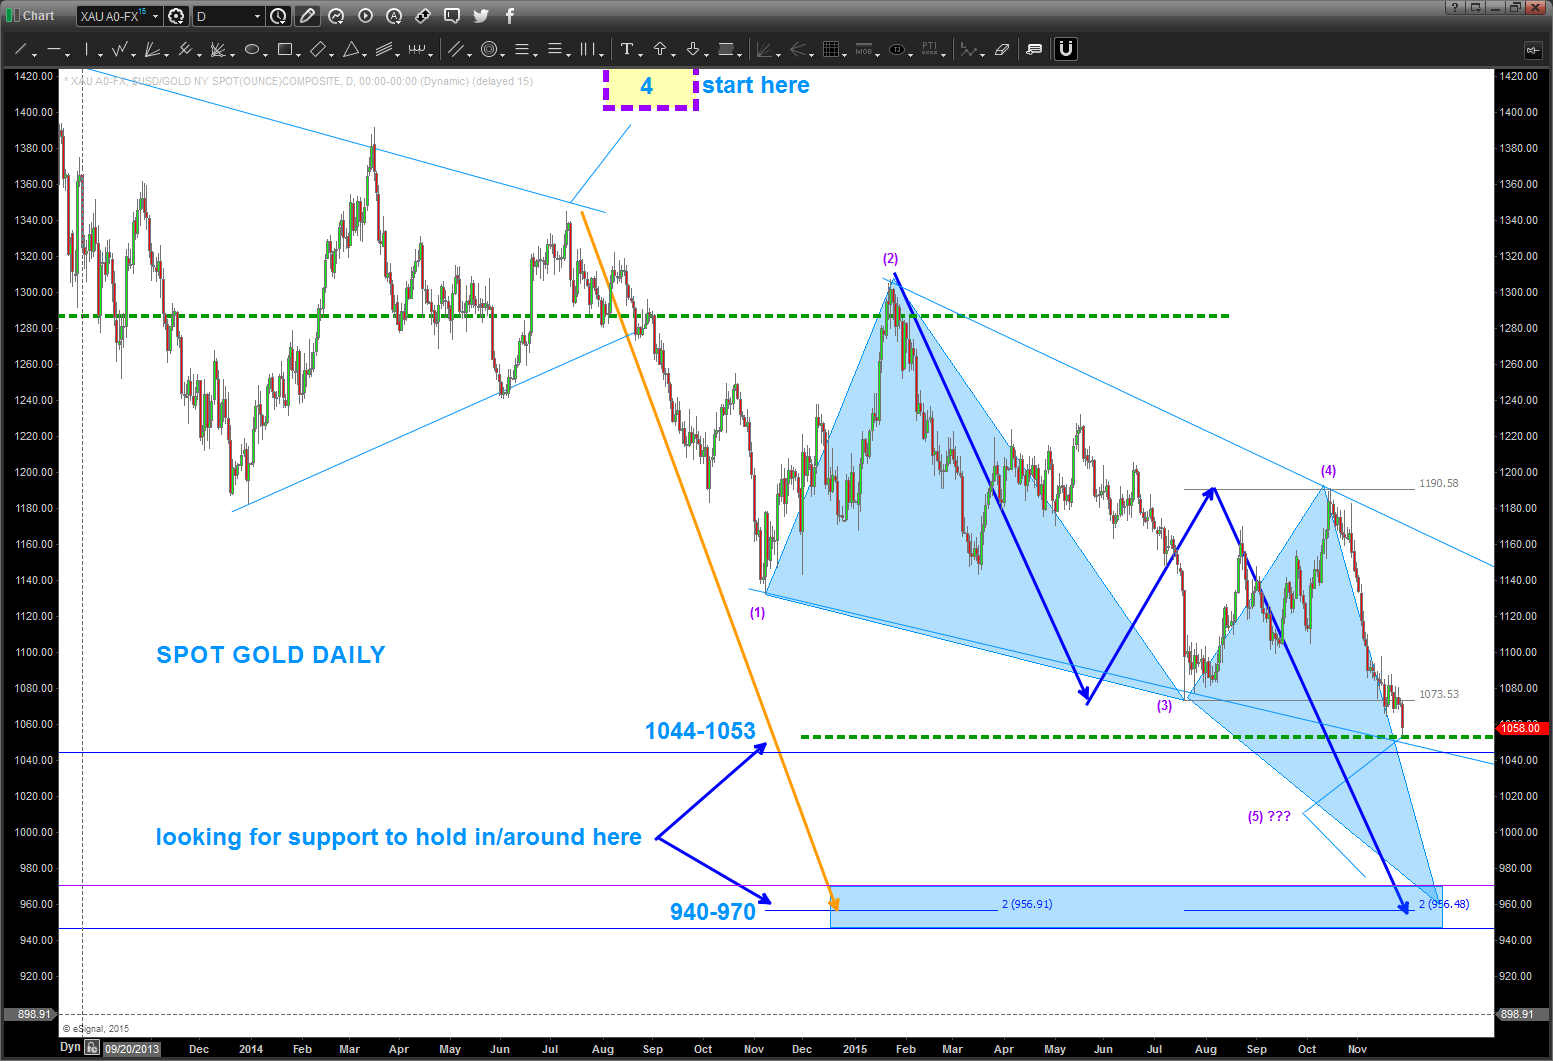
SPOT GOLD DAILY
I kept all of the work on the chart so you can work your way down from Monthly, Weekly to daily.
- pay attention to the wave that begins w/ the dashed purple (yellow shaded box) that says “start here”
- note the orange line – that is the representation of Wave 1 = Wave 5 and take us down to the 956 level.
- we appear to be carving out (Turkey reference) an ending diagonal. see page 36 of EWP.
- this is the same formation that we discussed about Coffee here: http://www.seeitmarket.com/coffee-futures-update-trading-price-targets-and-time-frames-14978/
- BUT AGAIN, the triangle 4 is a classic PATTERN so were in the 5th wave lower.
for now, pay attention to 1044-1053 and then 940-970.
one last chart …
- the entire “wave” structure that occurs is based on the initial impulse move.
- in this case, the blue arrow from the top at 1920 is the “rock that hits the water” and starts all of the waves.
- from there, we simply PROJECT the arcs outward using sacred geometry, musical notes, fibonacci, etc. and what we do is actually LOOK TO THE LEFT ON THE WAY UP.
- It’s basically “musical polarity” in that where the arcs caused support and resistance in the past should be areas of resistance and support in the future.
- also, the arcs usually have “measured moves” associated w/ them and at times the are the exact same move that occurred in the past happens in the future. shown below you’ll see another blue arrow that is associated w/ the 3rd expansion of the initial impulse.
- note the orange ellipses. those are area of support and resistance that the arcs caught on the way up and on the way down.
- can you trade off of this information? sometimes yes, but, what’s most important, is you can use the past to ascertain the rhythm and flow of the move.

cheers … Bart
