NATGAS update for a friend …
NATGAS as of 11:52 EST 11/23/2015
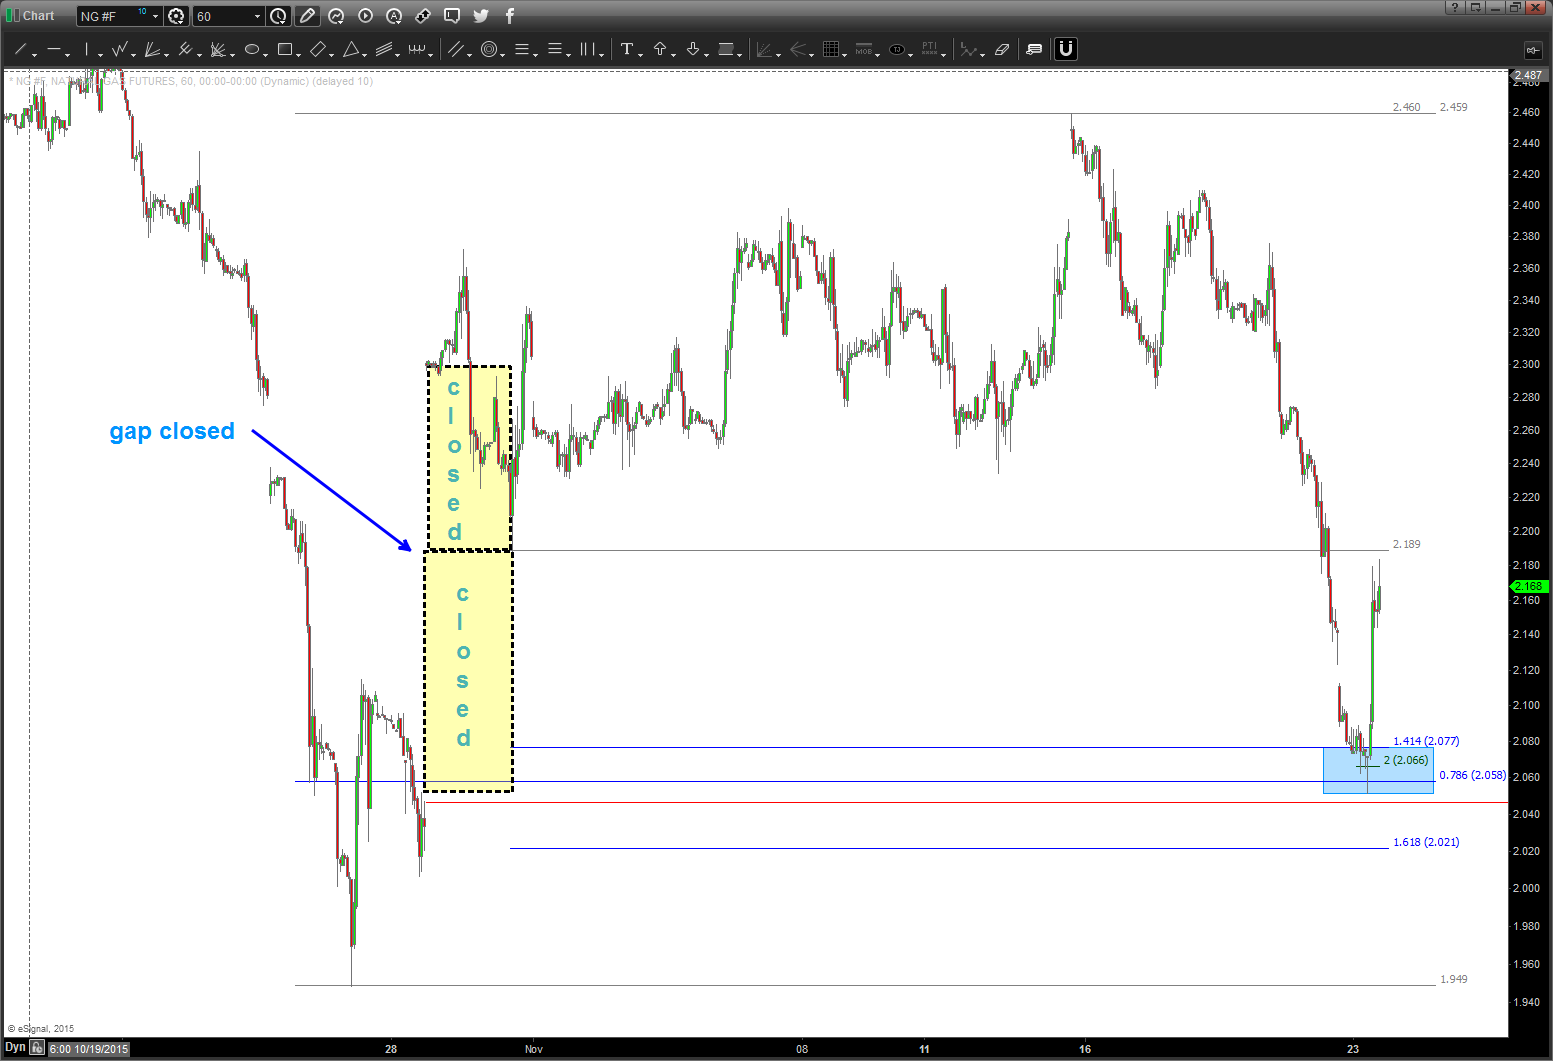
- note the red horizontal line – that is still just a little bit left of the gap that has not closed. it could go back down there to close it BUT price action from this level is promising.
- also, note the 2.021 level at that is a target (1.618 extension)
- RISK is a daily close below 1.949 for the larger time frame
- RISK intraday is the low that was made at the .786 at 2.058. NEED IT TO STAY ABOVE THERE.
Moving forward believe 2.231-2.56 will act as resistance moving forward. for the bullish case to work – need to bust thru there. DO NOT EXPECT IT TO HAPPEN on the FIRST ATTEMPT. IF it does THEN it’s strong.
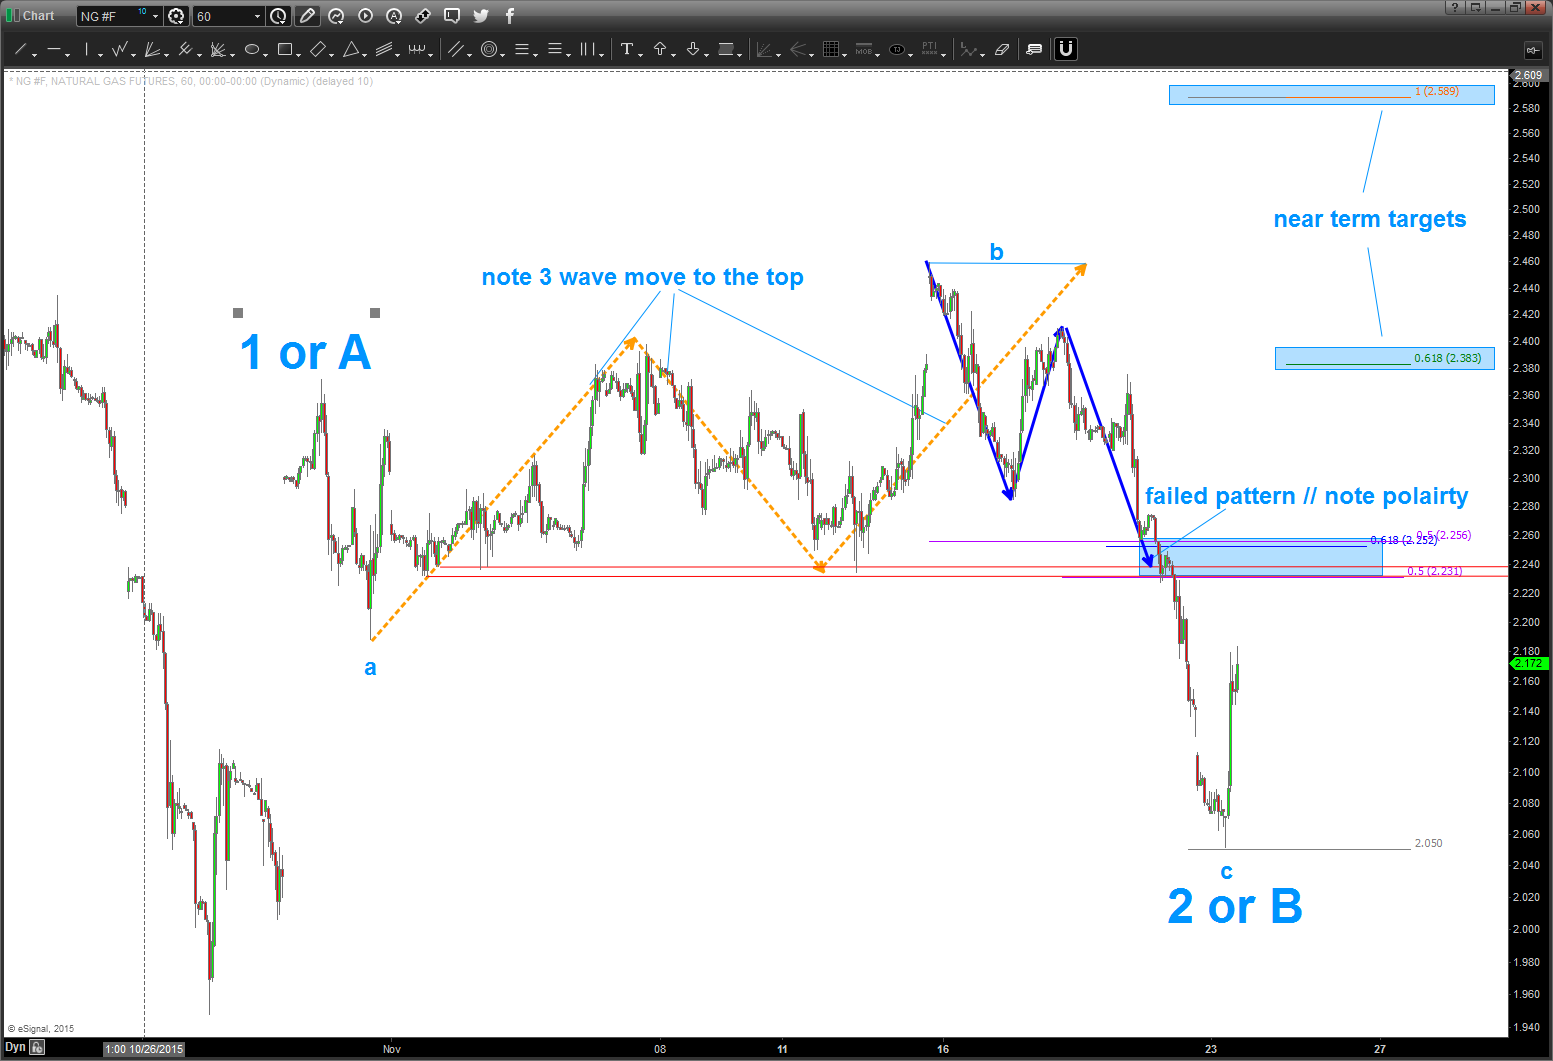
- note the count that I am going with …
- see the 3 waves to a top at (b)? that is a classic “b” wave and action after that top sure smells like a C wave. Thus, at 2 0r B if we are bullish then this level will hold and we should continue to start up.
- two projection are near term targets only …. 2.383 and 2.589.
- see the 3 waves to a top at (b)? that is a classic “b” wave and action after that top sure smells like a C wave. Thus, at 2 0r B if we are bullish then this level will hold and we should continue to start up.
- believe the 3.0 level is still possible but need to see price action at areas of resistance noted.
one last, a big picture look at the weekly/monthly so we don’t get to focused on the soda straw of intraday.
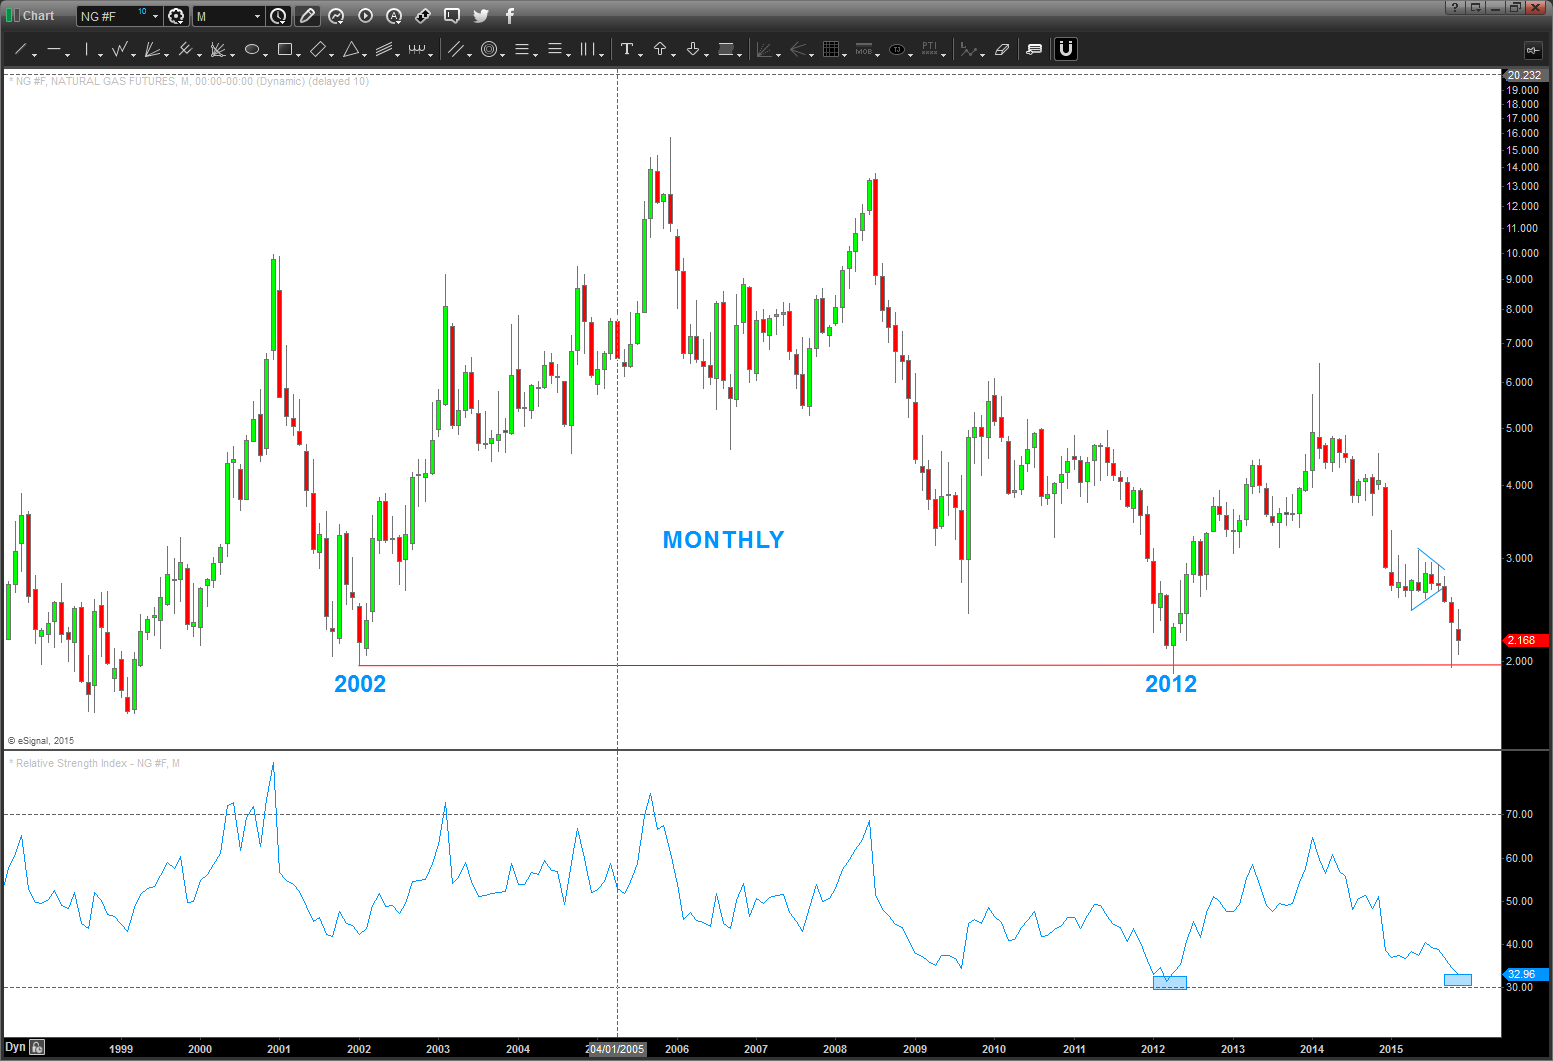
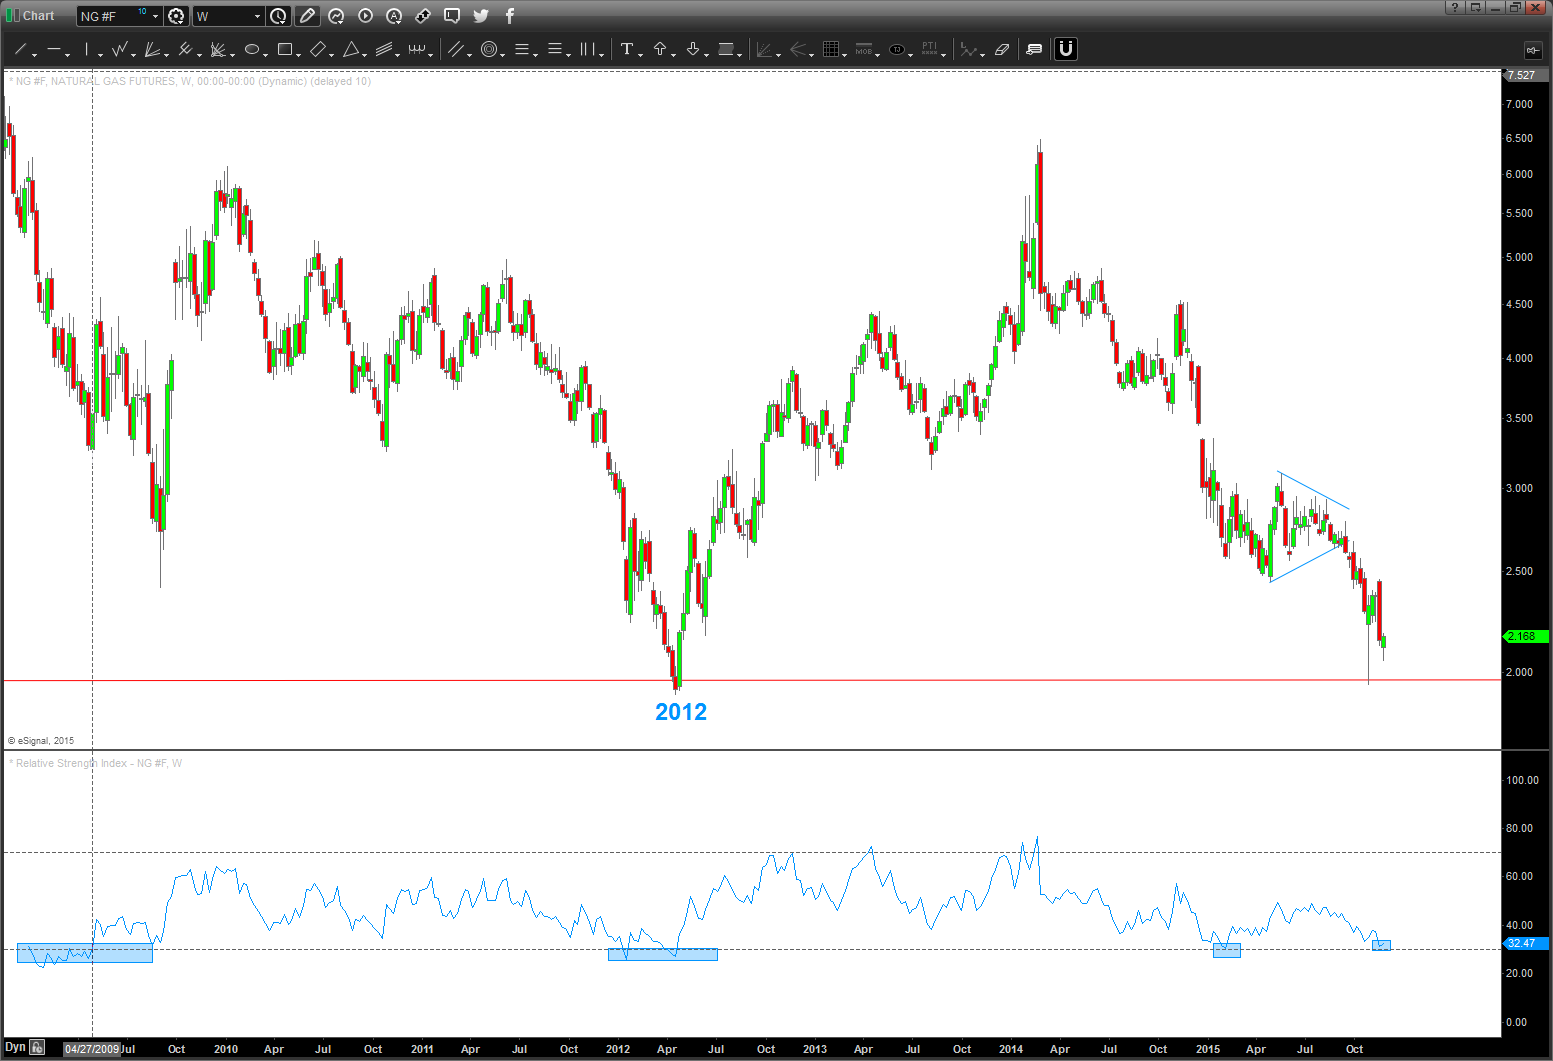
so, we are at deeply oversold levels and a countertrend bounce is due.
hope this helps.
Bart
