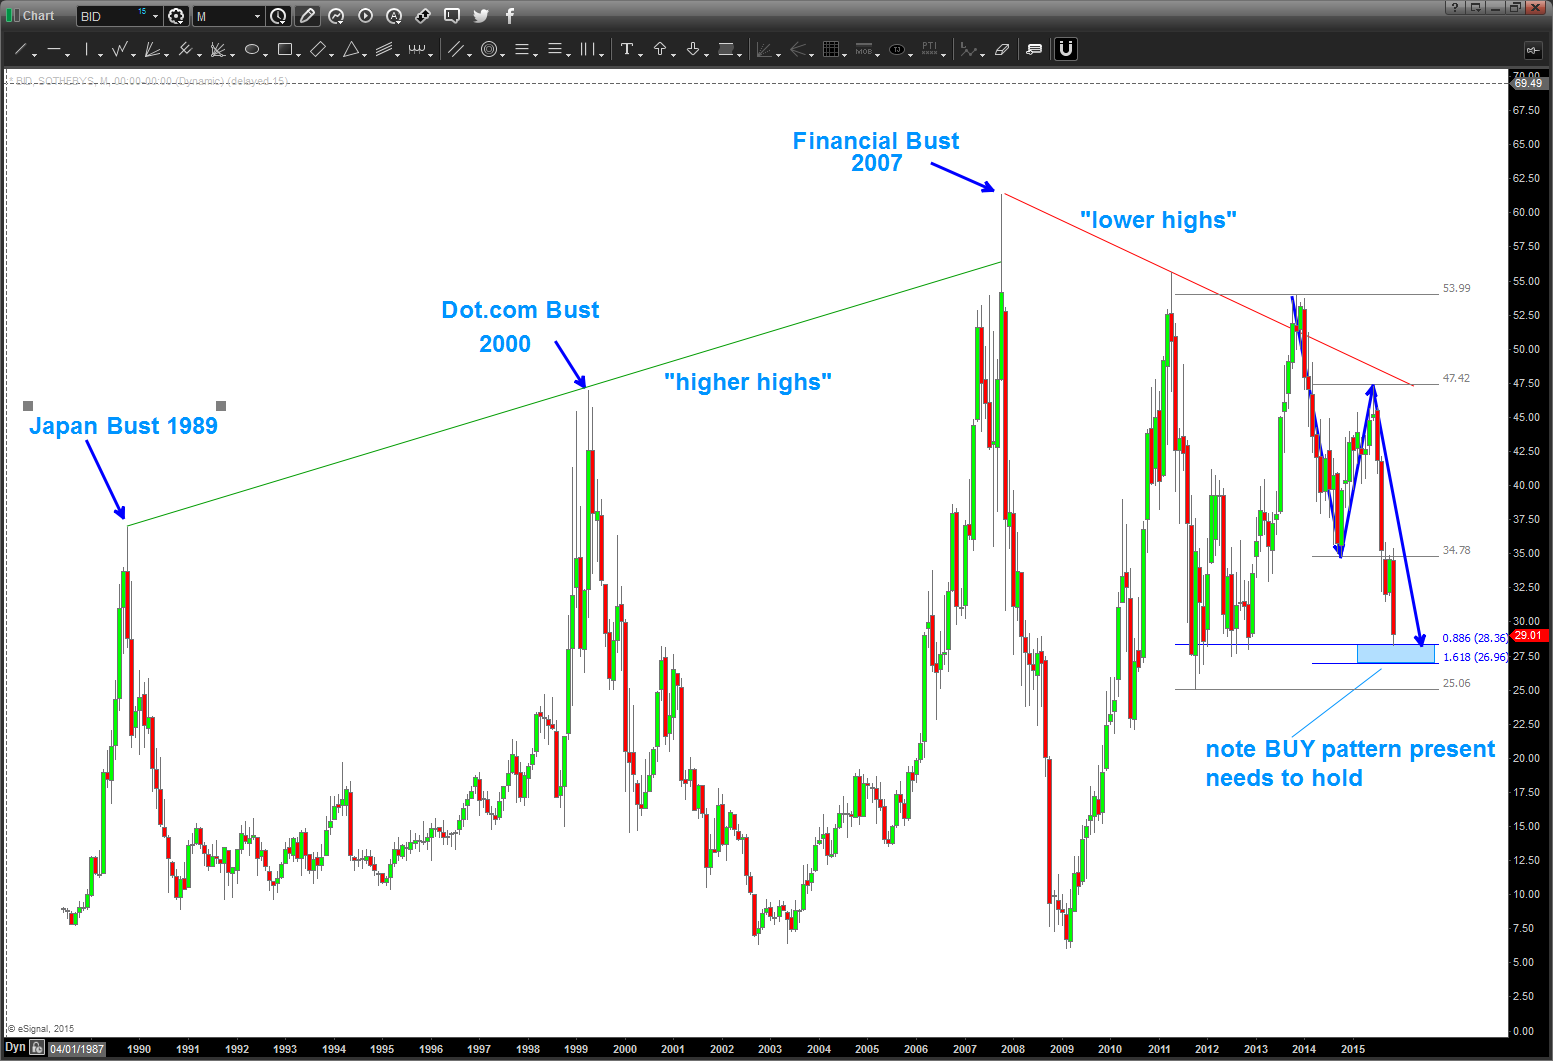
$BID Sotheby’s …
my good friend Larry sent me a chart this morning .. it’s a chart of Sotheby’s Fine Art auction house … fascinating as big moves down/up follow social mood and the market. It’s interesting to note the higher highs up into 2007 and since then the lower highs present.
it’s finishing a BUY pattern right now as of Friday … is it such a stretch to think the market will follow $BID up or down?
as always, what does the relative strength say? Well another BUY pattern is appearing a little lower and you can see that when BID outperforms – on a relative strength basis – the market overall $NYA finds the bid …
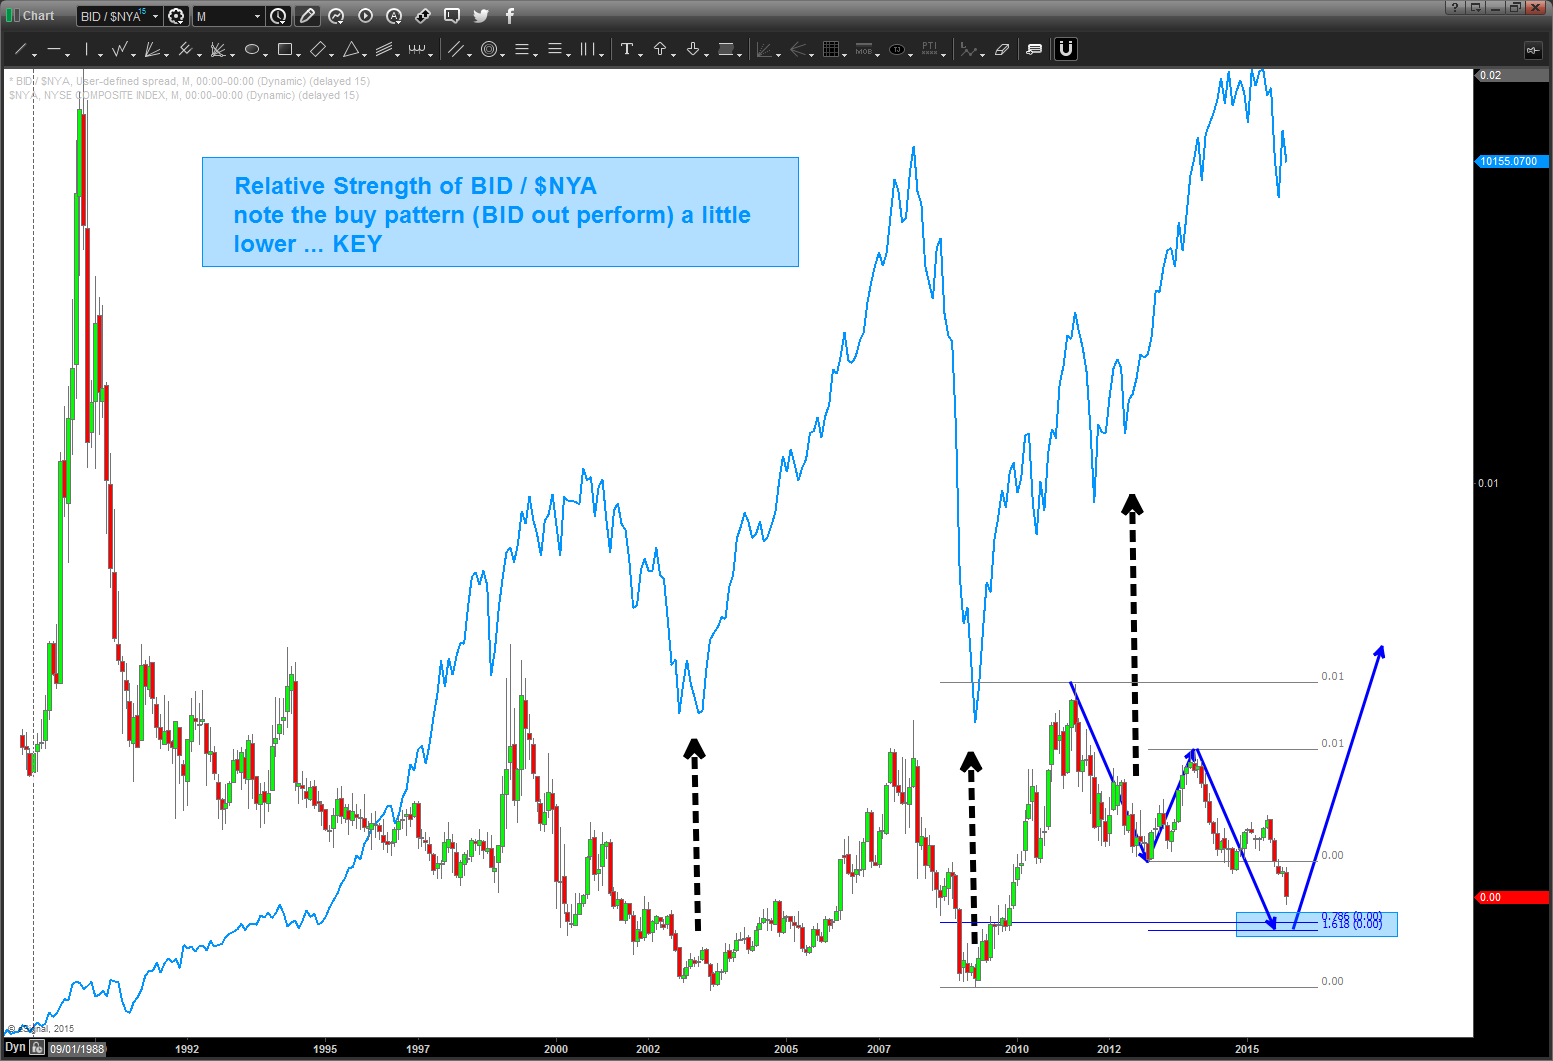
we are at some key levels for BID and it’s relative strength plot is getting close … stay tuned!
