$WFM …
I enjoy listening to JC Parets (@allstarcharts) (www.allstarcharts.com ) as he’s entertaining as hell and also knows his stuff. I blame him for getting me blogging and haven’t looked back since …he’s introduced me to blogging, google hang out, twitter and now periscope. today, was doing some emails and “periscope” popped up that he was cruising the charts so I simply hit the app and was immediately logged onto his computer screen where he was pushing some charts around.
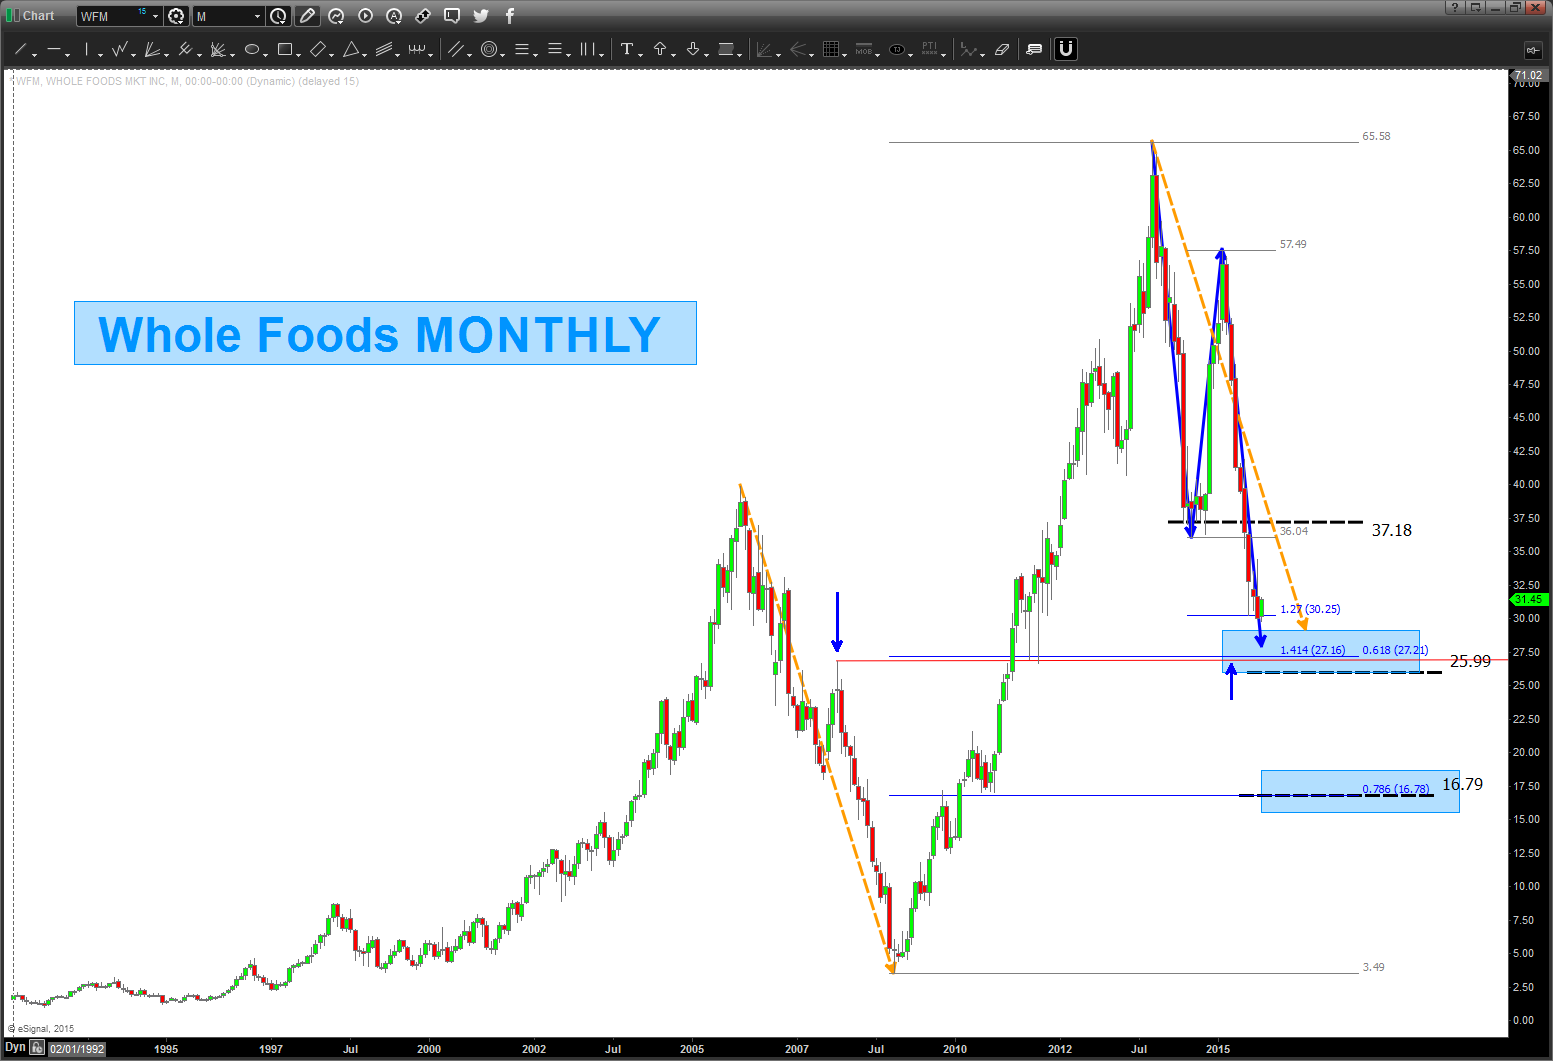
one of the charts – Whole Foods. Besides something about overhead supply, divergence, moving averages and stuff like that I called up the chart on a monthly and saw a PERFECT BUY PATTERN.
- note the blue arrows – projects into 27.94
- but more importantly, note that they are equal in PRICE and TIME right in/around here.
- note the extensions (sitting on the 1.27 extension right now)
- 1.4142 extension hits right on the .618 retrace (that’s good) at 27.16-27.21
- last, look at the dashed orange line .. it’s a measured move which represents the largest corrective move since the all times lows in the early 1990’s
So, sure looks like it “should not” go thru 27 so it presents a nice risk reward.
how about some math?
- (square root 65.58-2)^2 = 37.18
- (square root 65.58-4)^2 = 16.79 (right on the .786)
- (square root 65.58-3)^2 = 25.99
so, we have a LOT of thrust coming into this level but a lot of math is coming into play in/around 26-27.
thanks JC!
Bart
