the YEN, the S&P 500 and the world of ‘if – then’
my friend and fellow chartist and trader did an awesome post on the JPY and the US Equities: http://allstarcharts.com/its-the-yen-stupid/
below is a chart (intraday) showing the strong correlation …
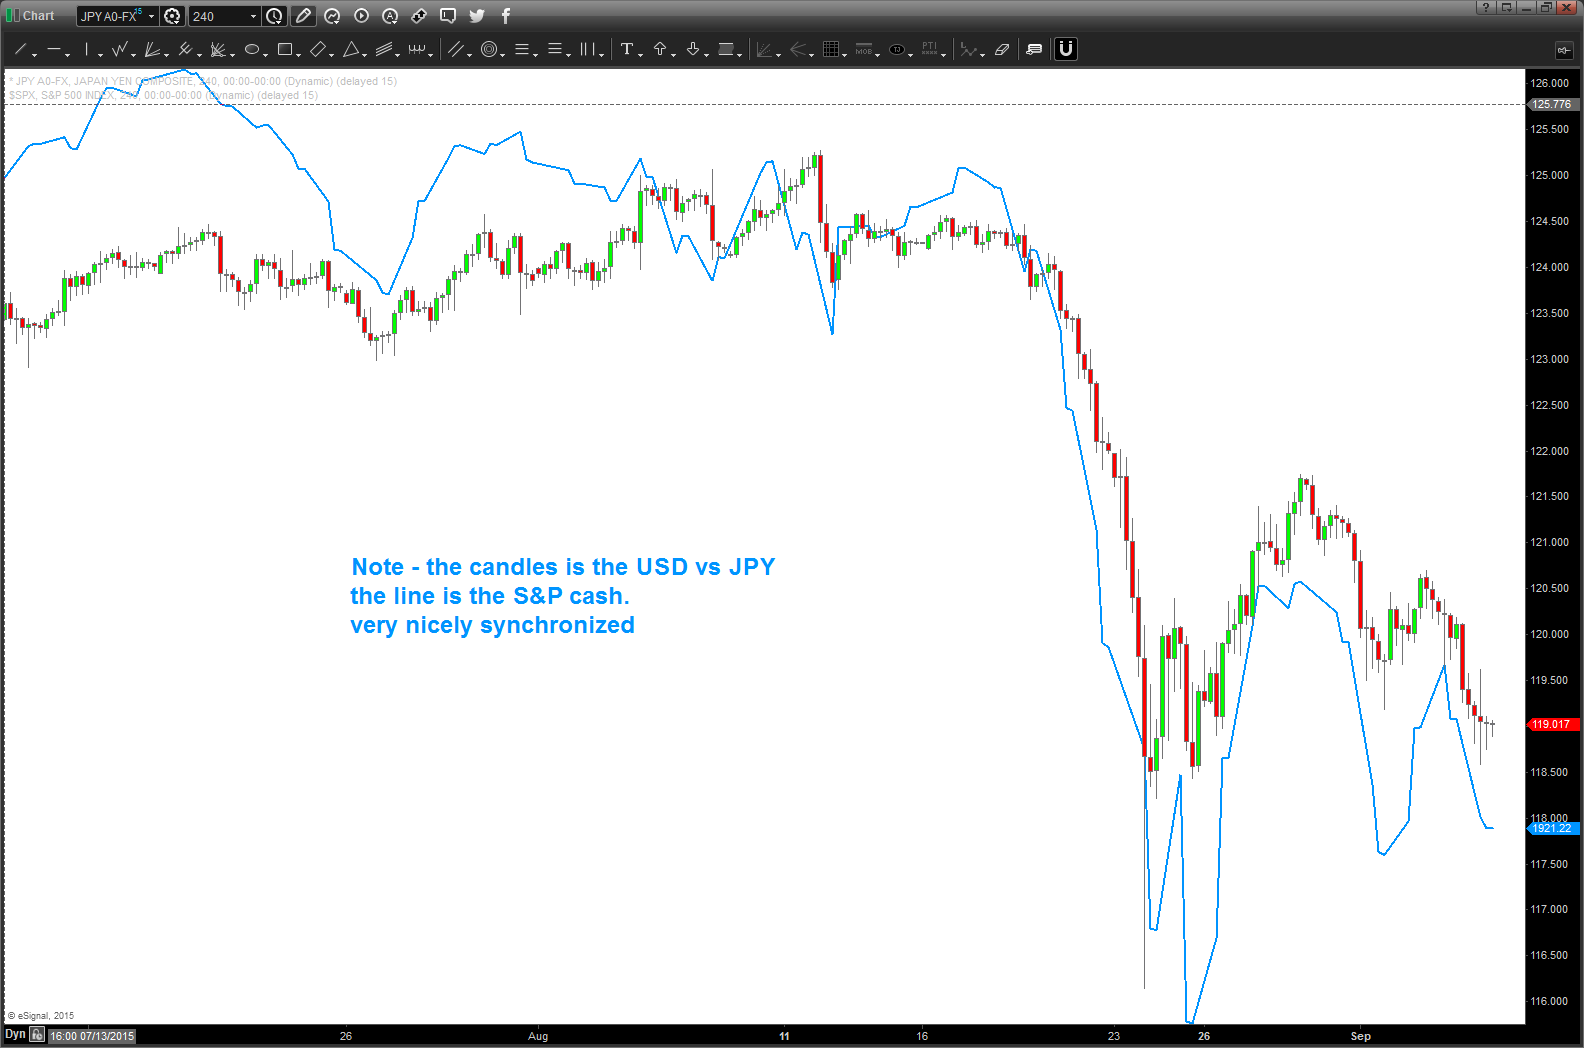
note the correlation of the USD vs YEN and the S&P 500
so …IF THEN ..
IF the correlation remains intact – probability is it does but you never know THEN a BUY pattern appearing for the USD vs the JPY would signify SUPPORT for the US Equities complex.
so, here’s the BUY PATTERN I’m going to try and play on Sunday night …
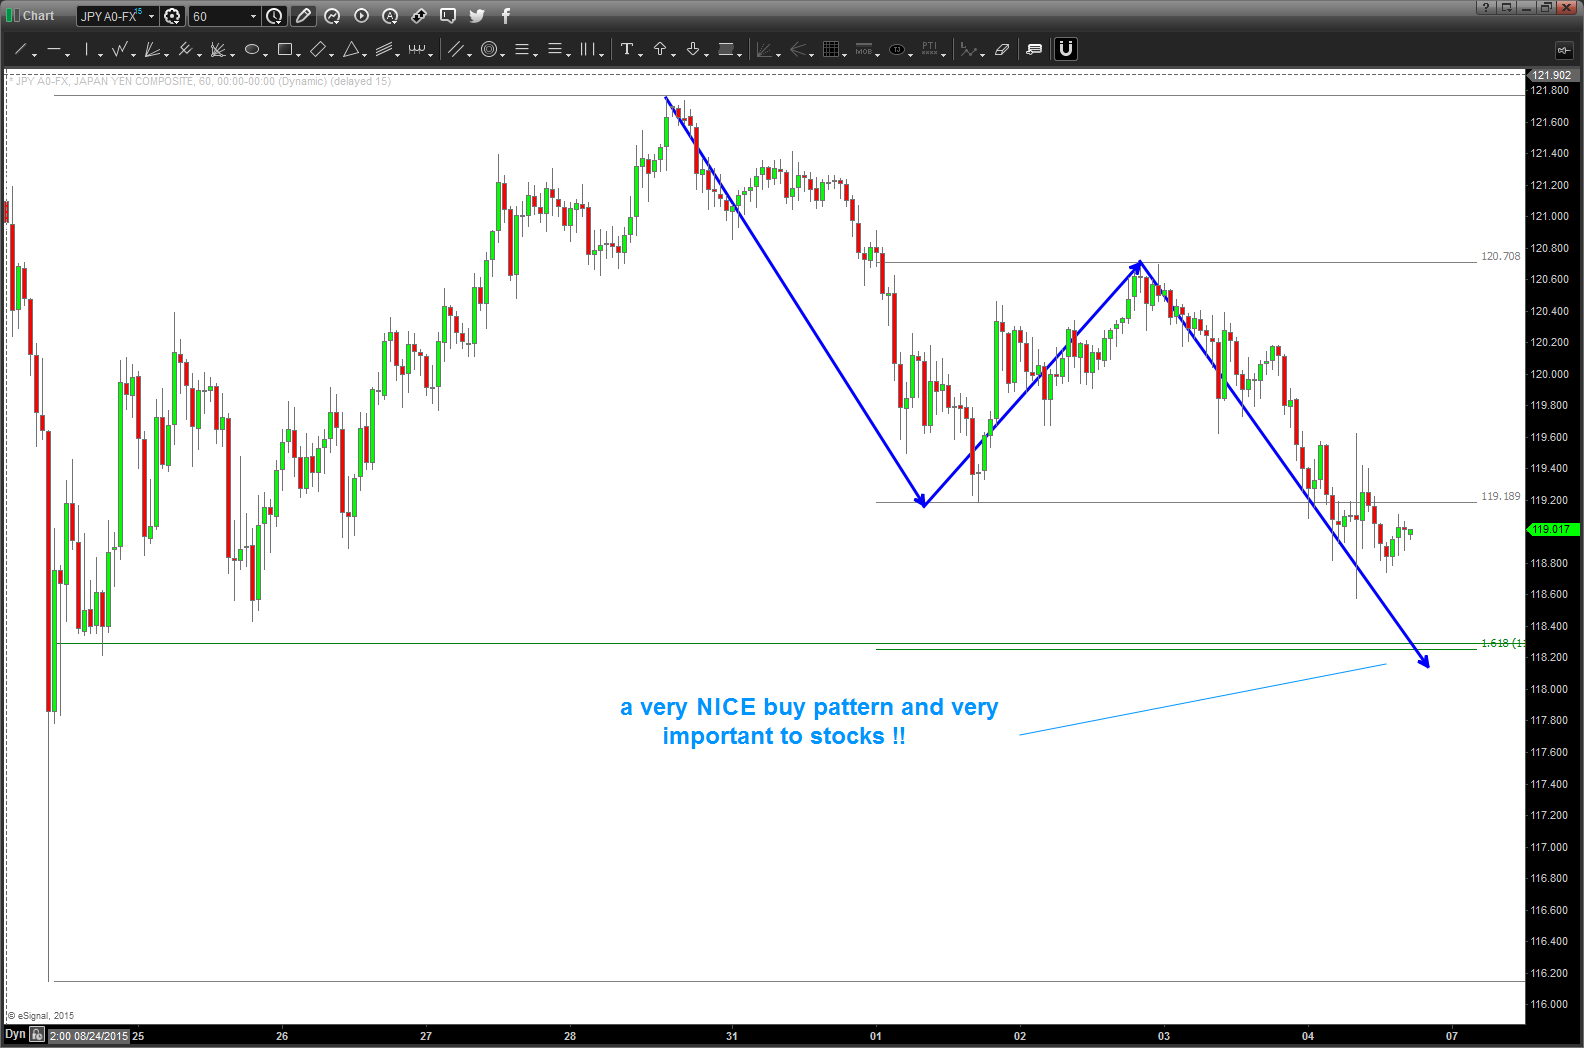
BUY pattern for USD/JPY. IF it works then “support” for US Equities?
pay attention to the world of FX …and, particularly, this BUY pattern.
IF it works THEN equities SHOULD find support.
IF it FAILS then … failed patterns aren’t a pretty sight and I’ll leave it at that …
118.20 on the USD vs YEN gonna be key.
Bart

Thanks Bart! Any prelude to consolidation (or not) is greatly appreciated.
Jerry … will watch it closely. For now … pay attention to this USD vs JPY BUY level … it is one of those “perfect” geometric patterns. PROBABILITY is it should hold .. if it doesn’t then, well, look out below. Hope your well mate! BART
could not agree more