Nike updated … target coming into play
Below is a post that I did from November 2014 roughly 7 months ago.
Targets for NIKE are coming into play.
Hope your having a great weekend.
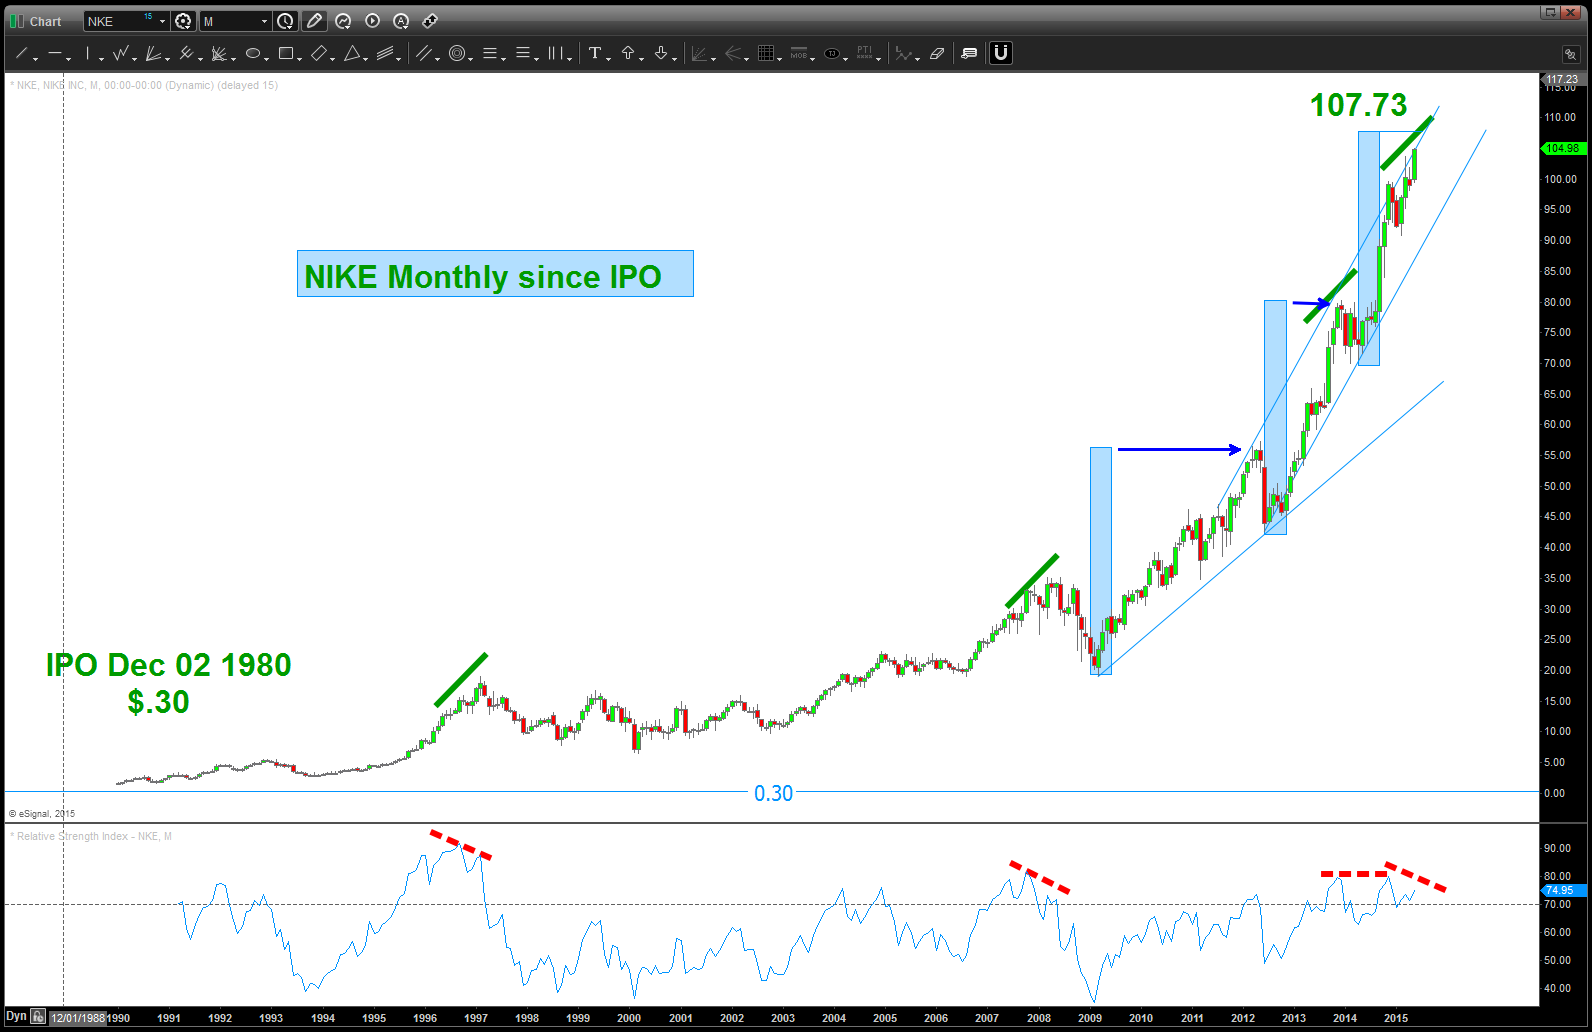
NIKE Monthly Updated
I’ve shown this technique, successfully, on the parabolic run in IBB, AAPL and others. I’m not going to repeat it here – search on this website for IBB or AAPL and Sir Isaac Newton and the APPLE falling from the tree. But what I’m going to do is go chart by chart to TRY and figure out when the Tv=0 (Terminal Velocity) and it falls like a rock, literally. These types of charts scare me …
- I have NEVER seen a parabolic rise that doesn’t swiftly lose 20,30,40,50 % of it’s value .. never.
- I have NEVER done this exercise on Nike (NKE) Fact is I like Nike, just bought a pair of running shoes the other day and they employ my daughter at the local outlet mall. But, shoving that all aside – it’s parabolic and that’s just not good.
1. Chart of NKE
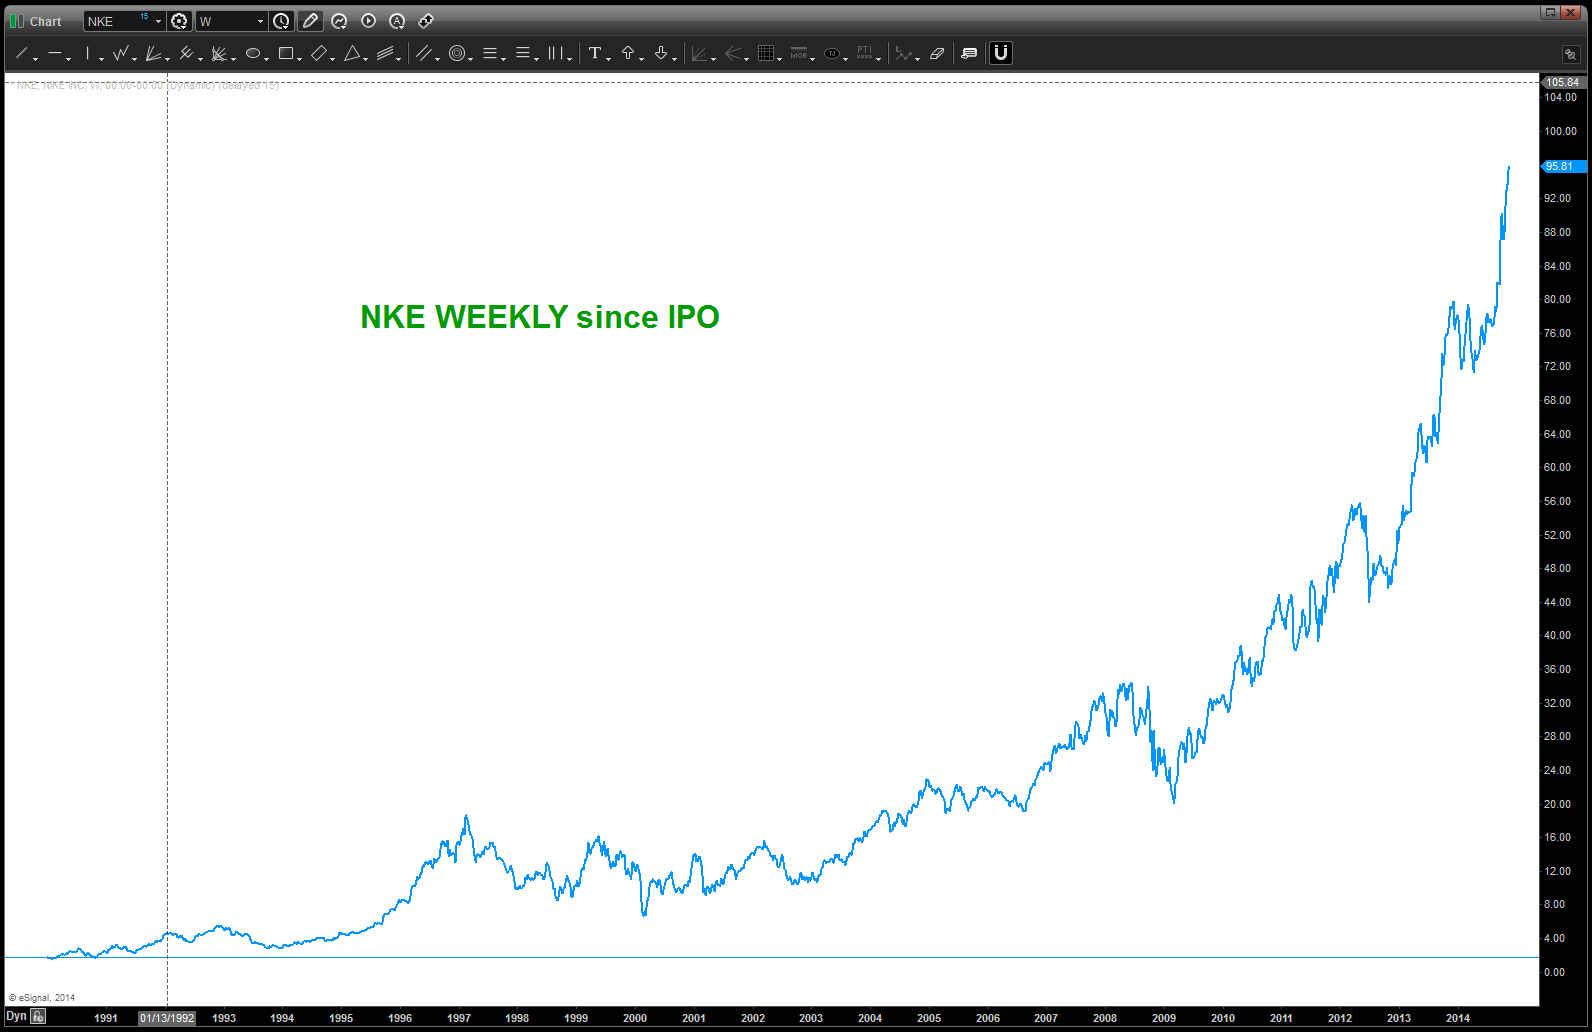
- note, used the “line chart” so I could fit the history of the stock into the screen and scaled it down considerably. using a line chart helps you.
2. Pick 3 points, that make sense to the eye, and calculate a circle from those 3 points like the dude did in the video link below
- Use this link from geometry we learned in elementary school: http://www.youtube.com/watch?v=GUgMOzwCBEE
- Or “GOOGLE” – “how to make a circle from three points …
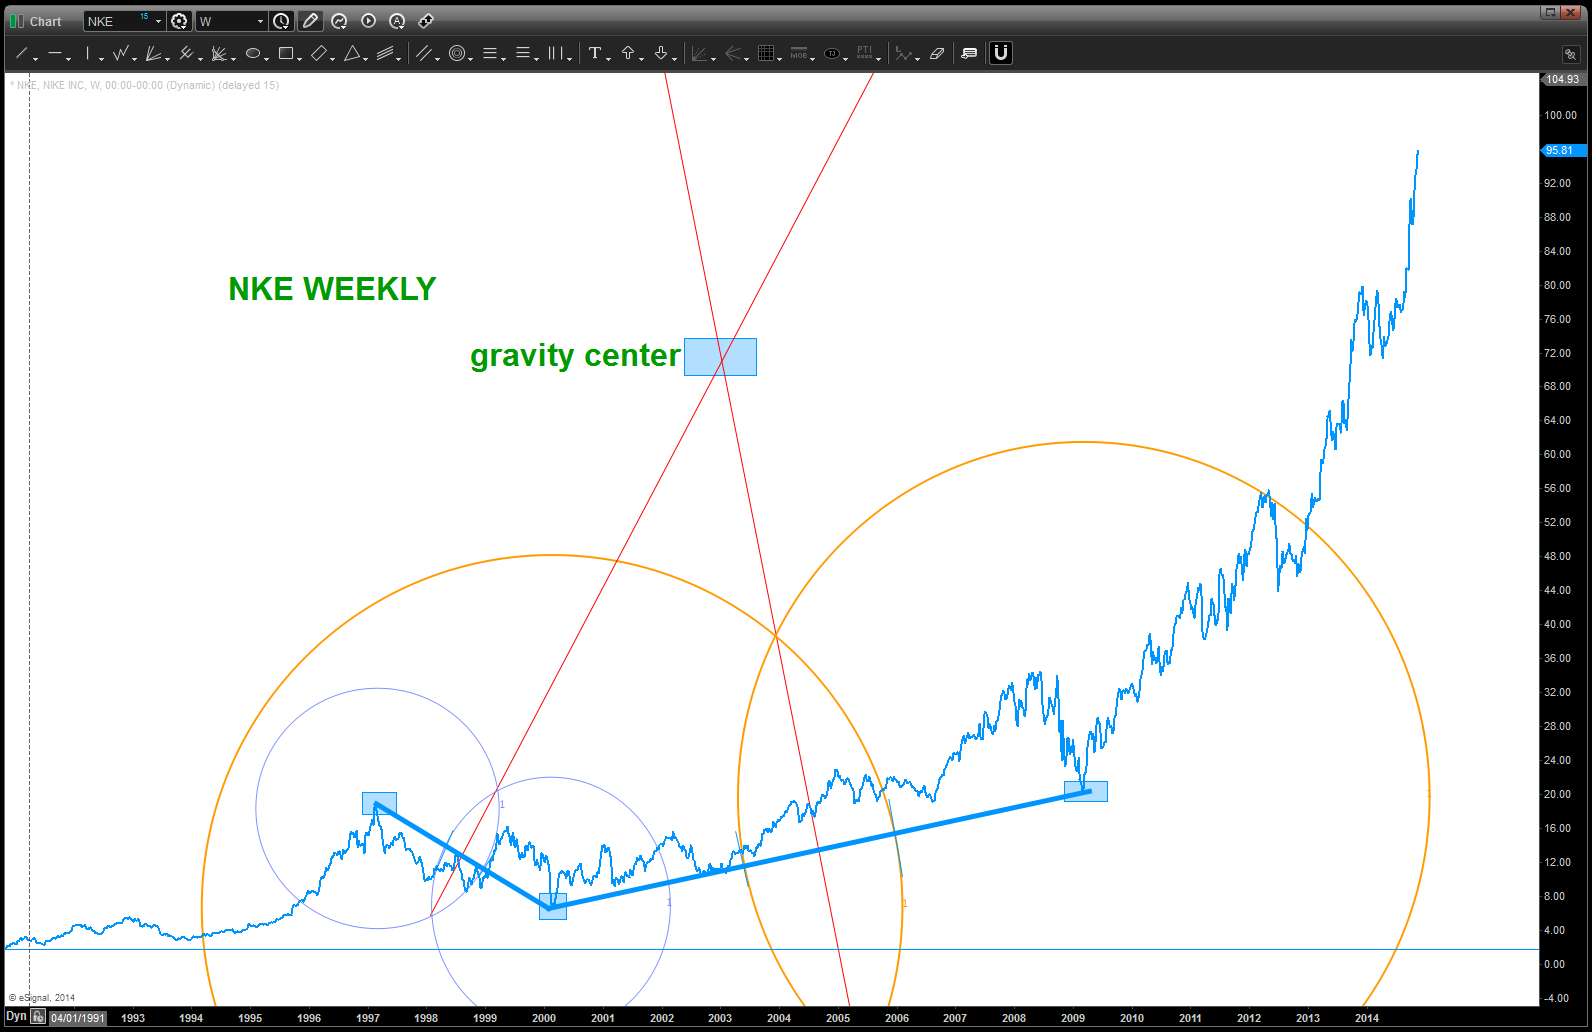
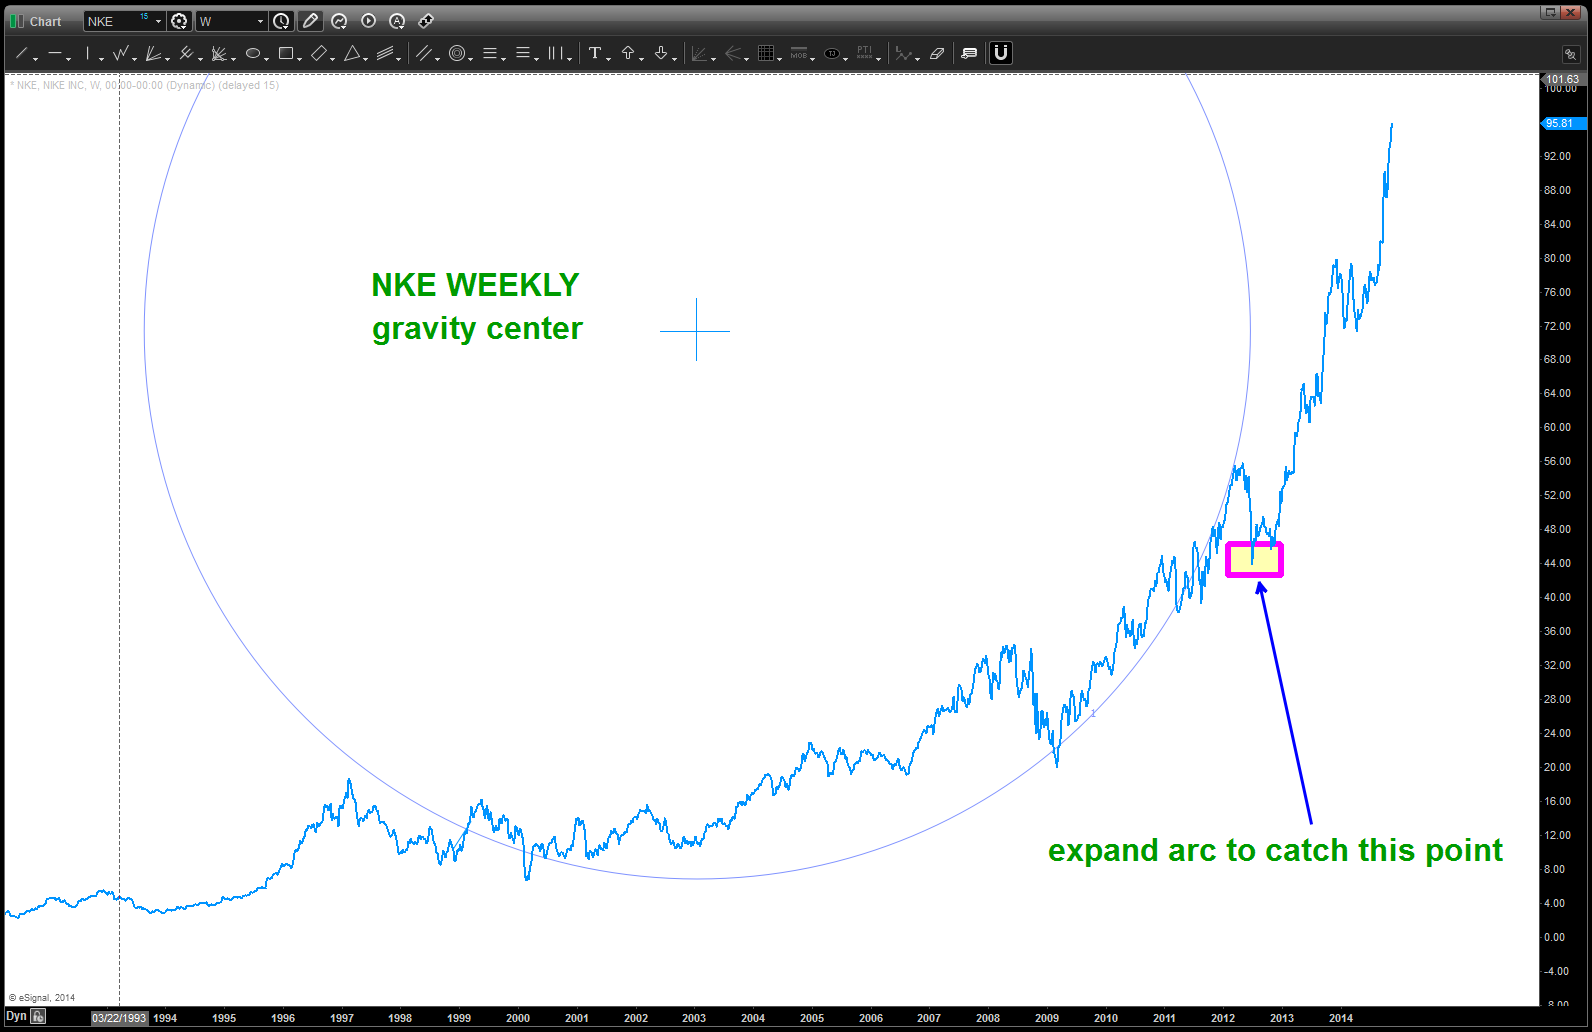
3. Here’s the picture w/ the gravity center and the arc shown. I don’t like it, you’ll see why. So have we done something wrong? No, just not using the right grid. Do you see how the all time lows did their own “mini” parabolic run back in 1997? So, decided to shift up the low horizontal grid line to the “next” low and … look two charts lower. Please pay attention to the annotations on the chart.
Note, by using the all time low to extract the radius from the gravity center it was not a good fit to the eye or thru geometry. Scratch this one …
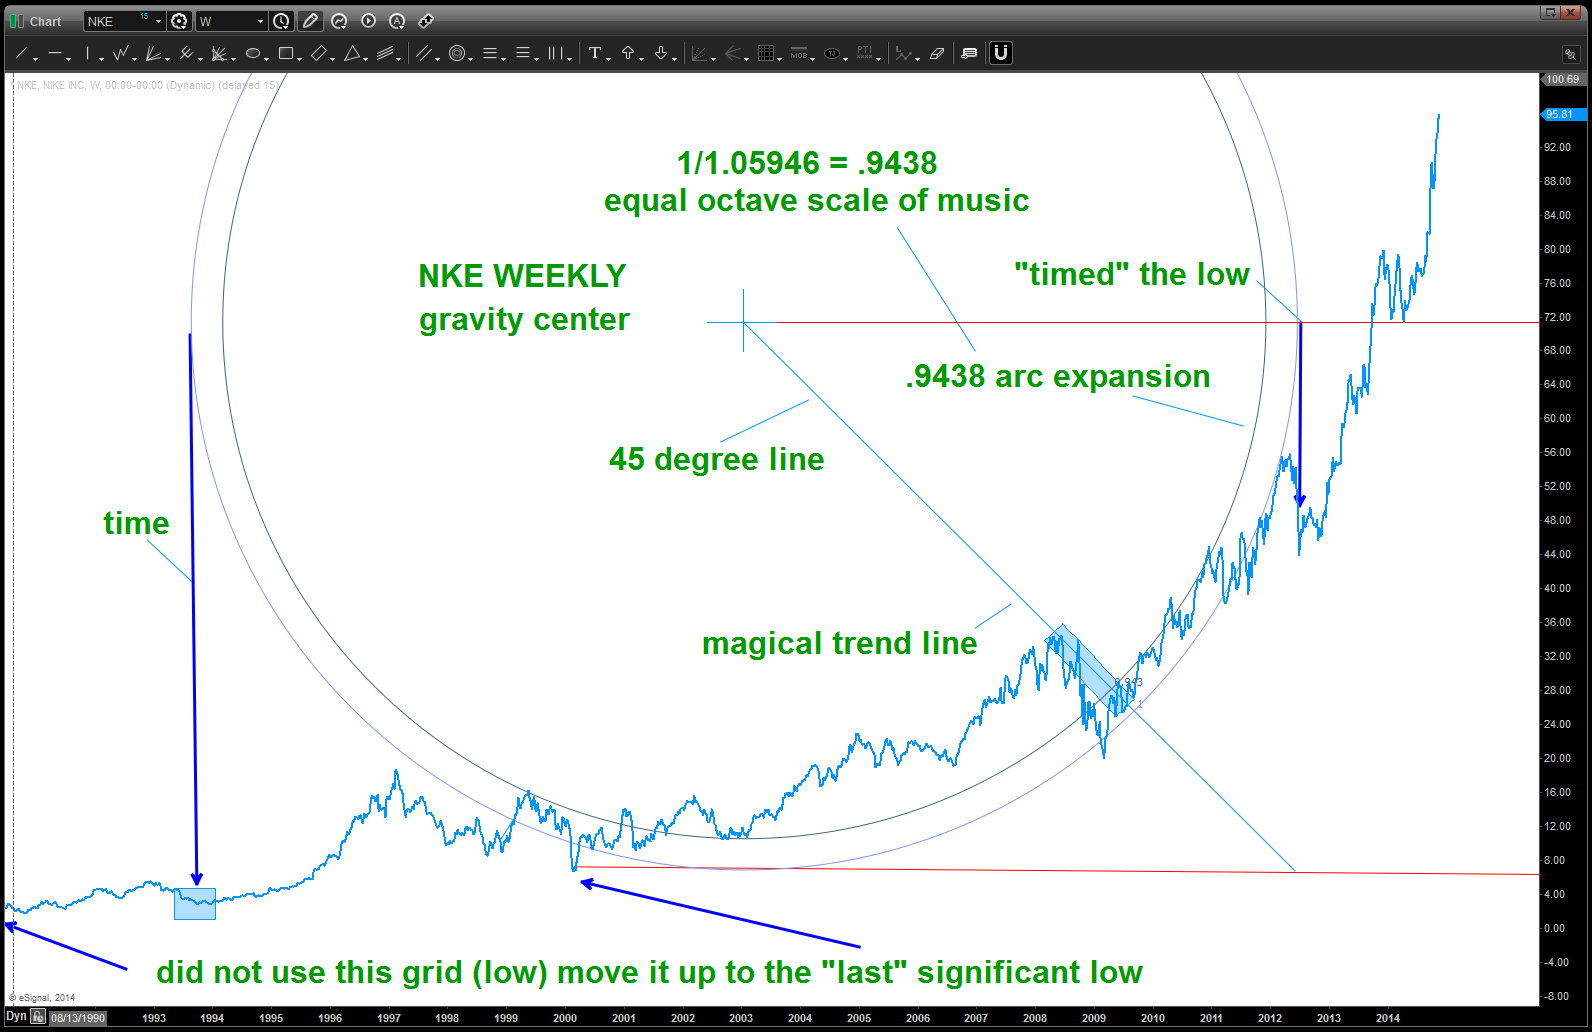
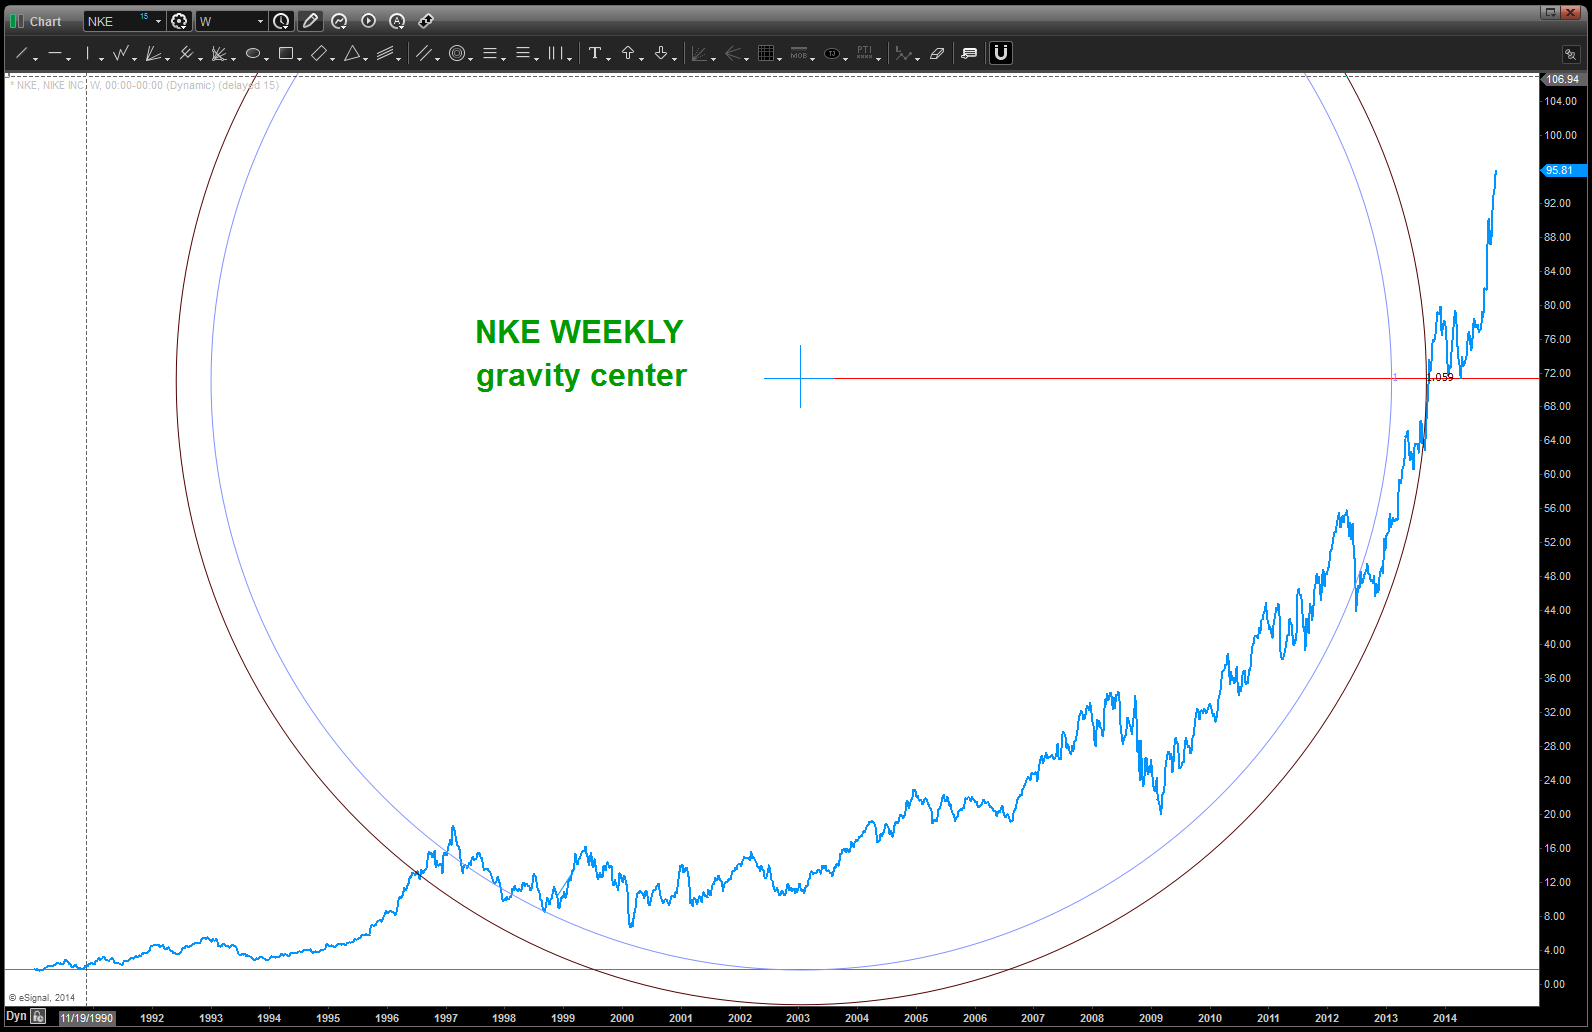
this grid workds
4. Now, we need to catch the highlighted area w/ an expansion of our 1.0 arc. This expansion is not arbitrary .. it will be derived from sacred geometry ratios, equal octave scale of music and Fibonacci. When we catch this point we then look at the parabolic extreme point at 3 o’clock on the arc.
what you’ll see is I used the musical ratios: 1.12248/1.1892/1.2592.
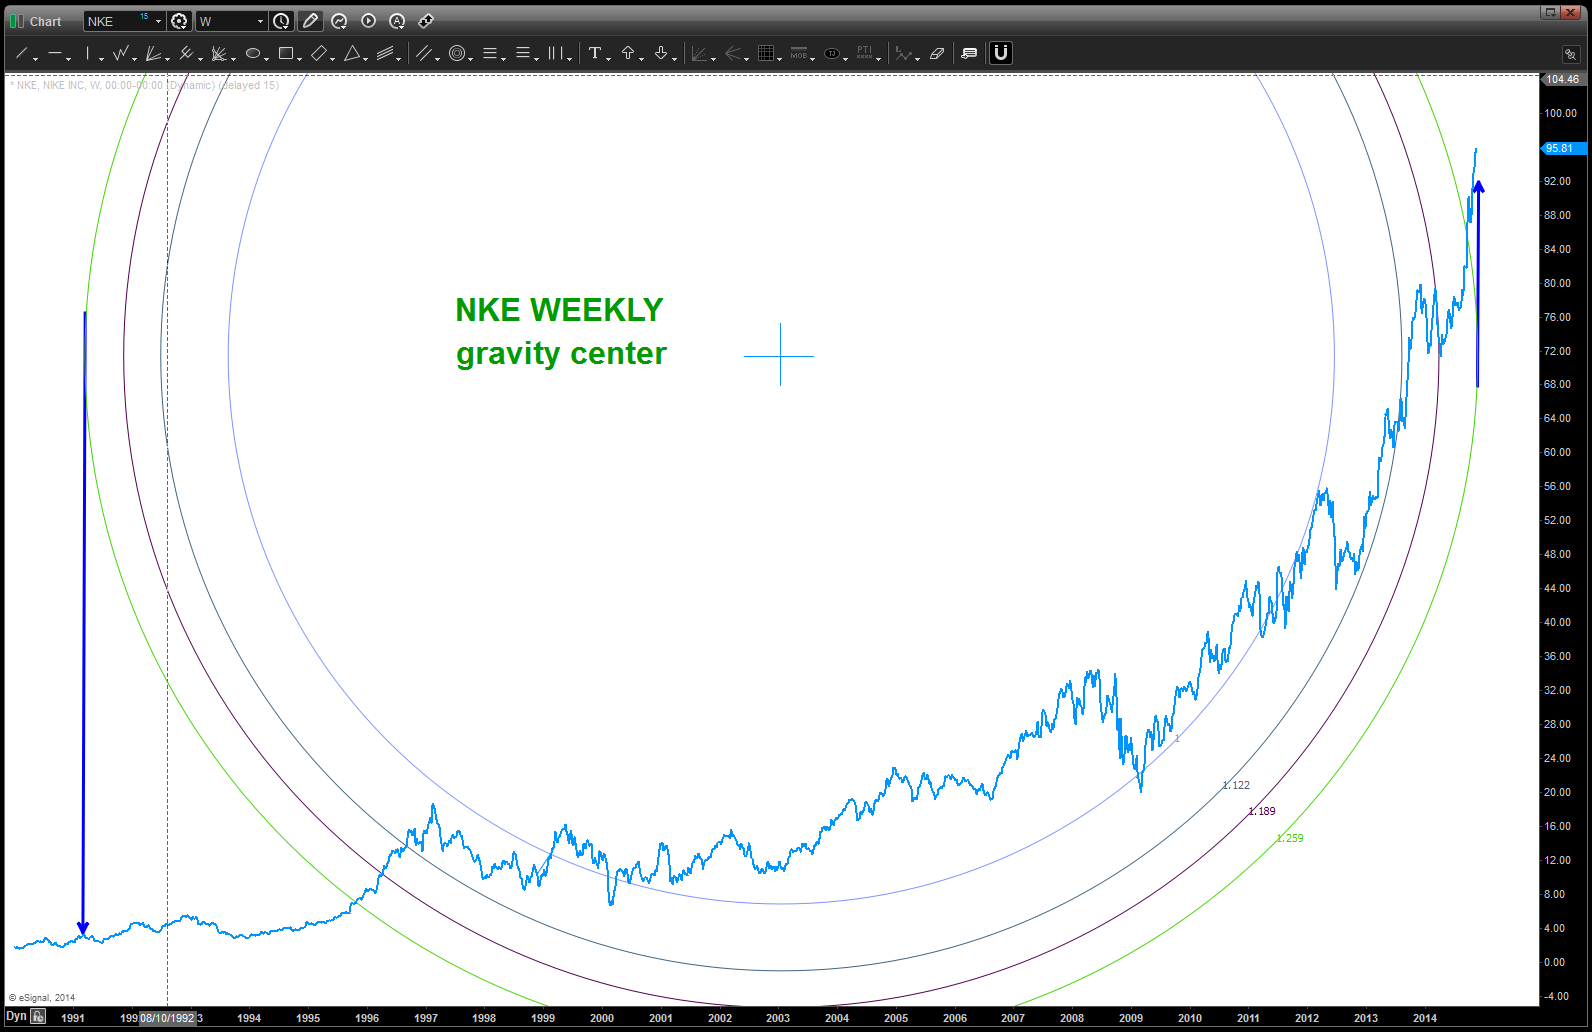
the green ratio could be it … so what else can we try?
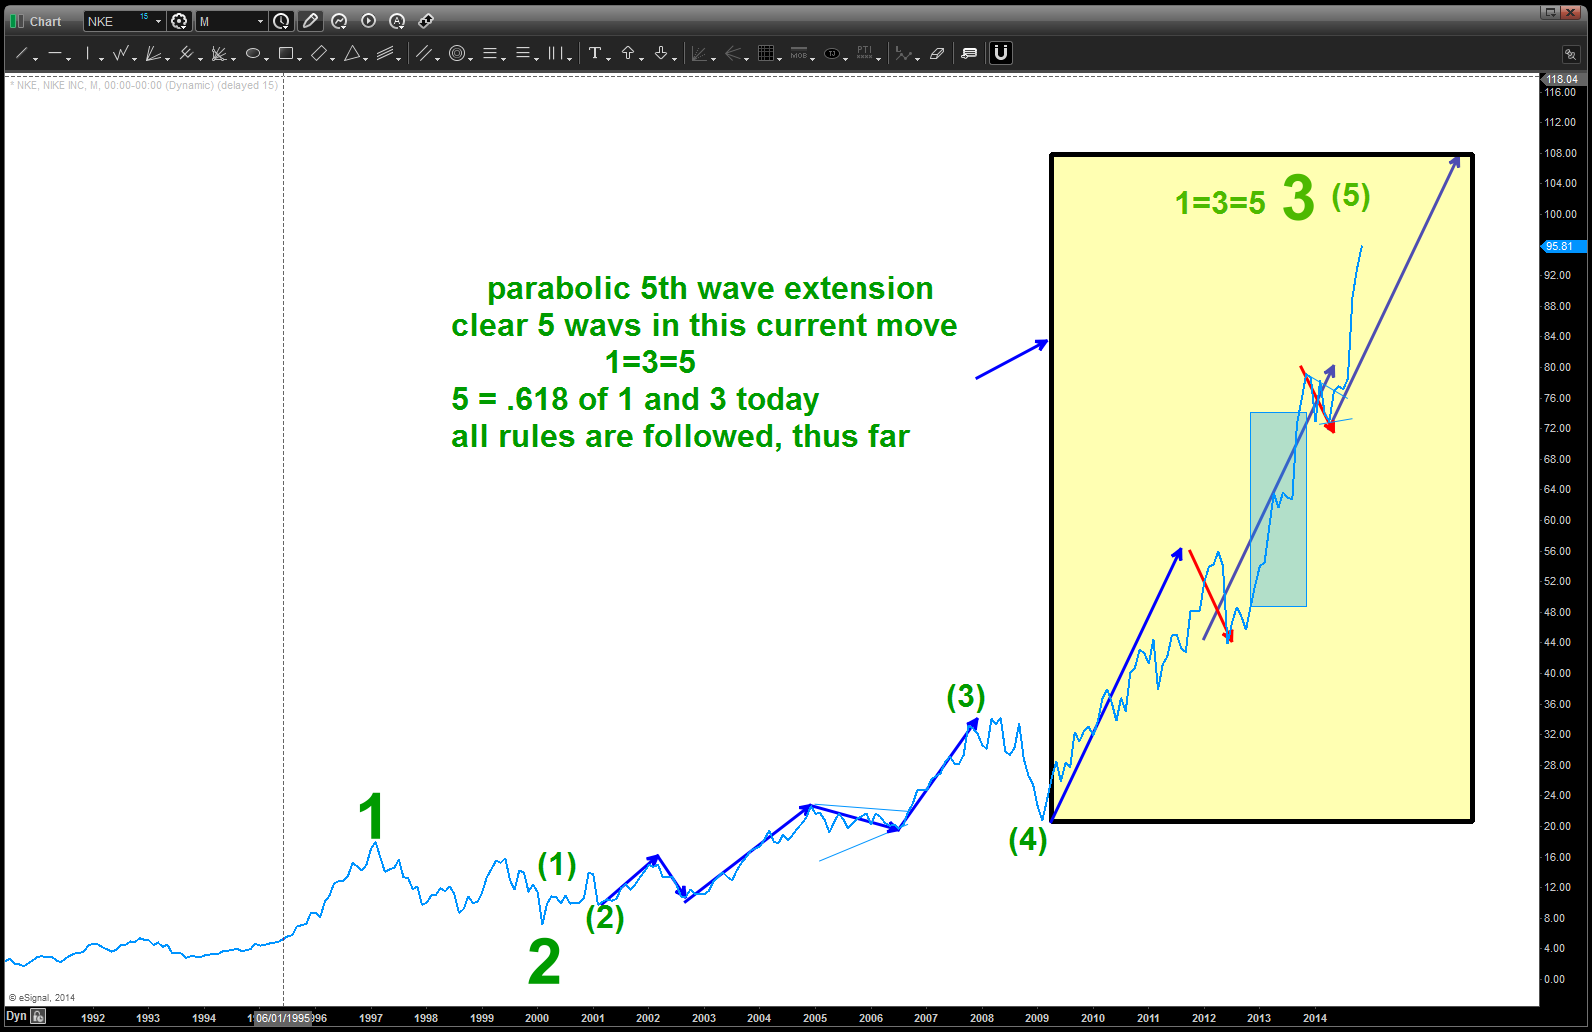
5. Elliott Wave perhaps but in log scale …because that allows us to see long term waves better, that’s and, also, take it out a scale (monthly) to remove most if not all of the noise.
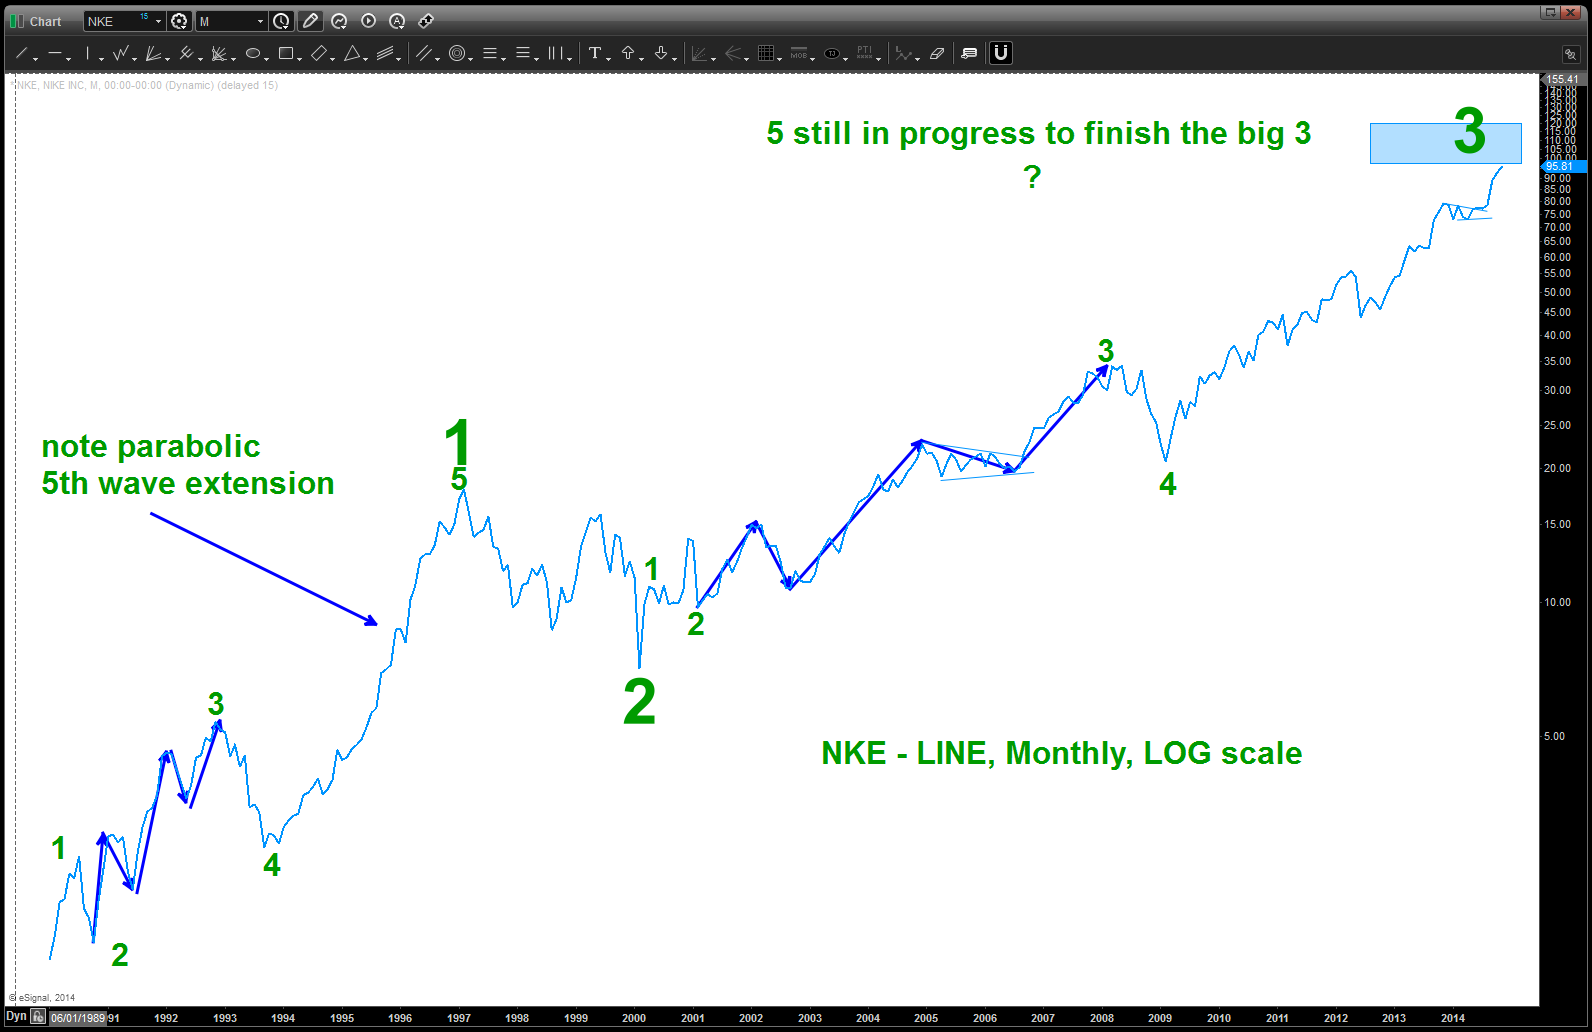
so looks like a nice 3 is in progress perhaps … I’m having a tough time counting the squiggles on this last wave and if that happens I simply WAIT for a form/proportion to show up. Remember, it’s PARABOLIC right now so it is hard to count …but in the context of being on the right side of the market … would definitely look to take profits at the first sign of a weekly signal reversal candle. so, if it’s hard to count then, perhaps go back to the normal scale?
6. How about bearish divergence on ALL of the DAILY, WEEKLY, MONTHLY? (remember his is real time so I’m not sure if it is present or not)
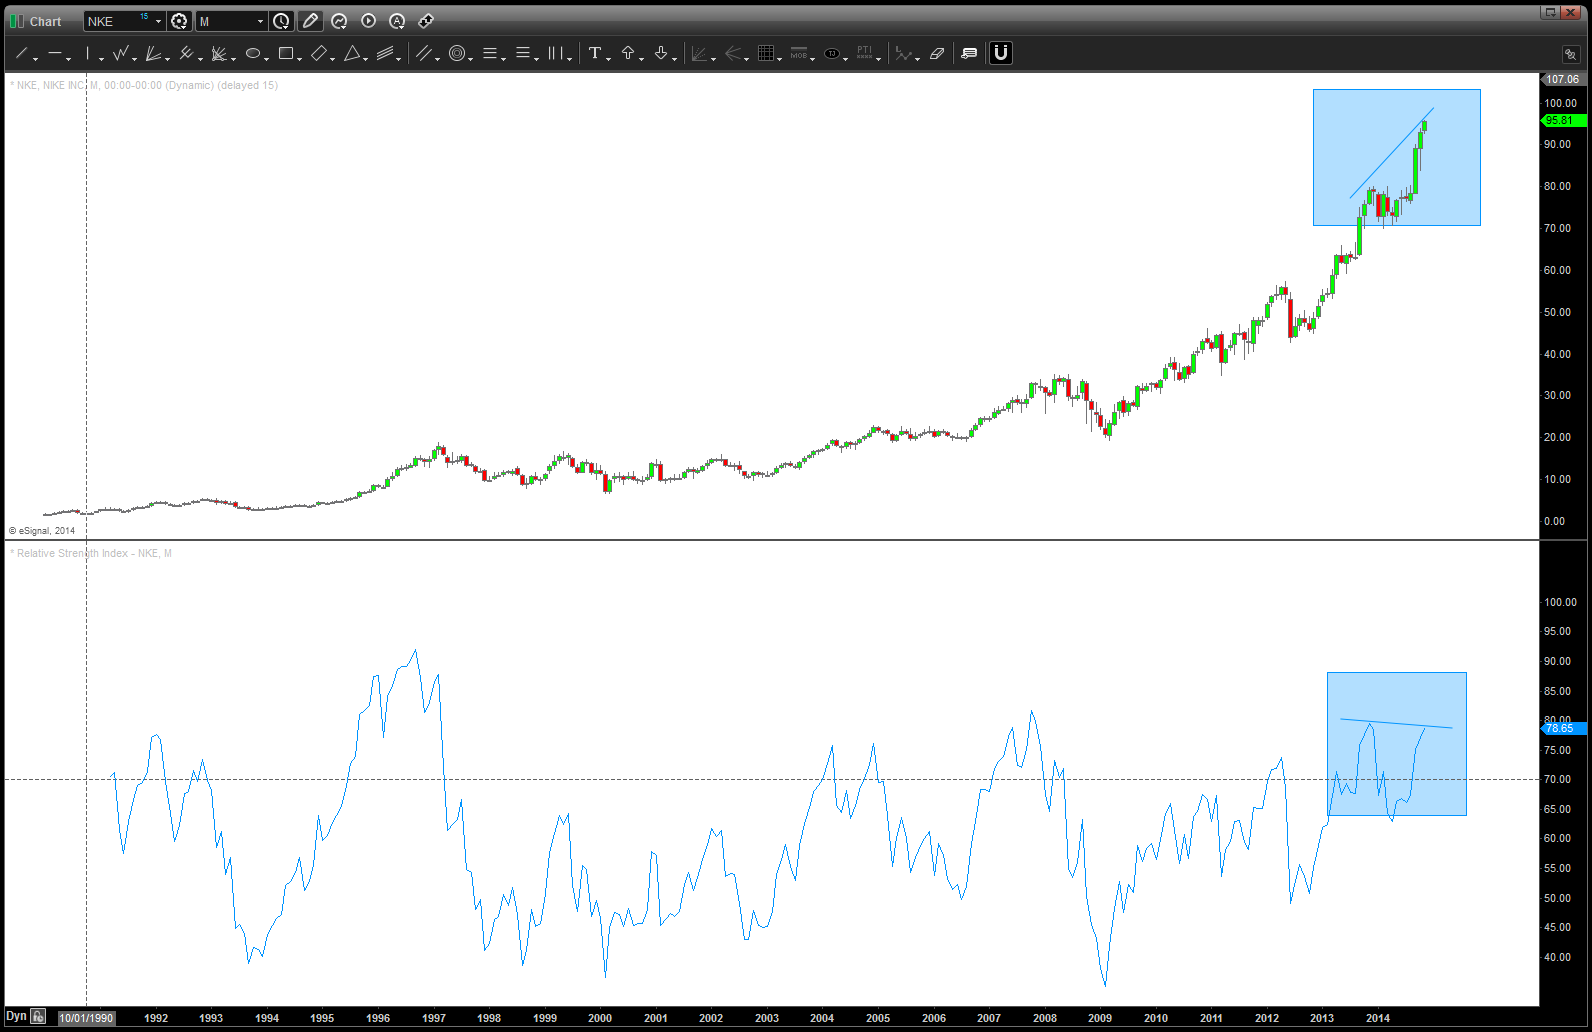
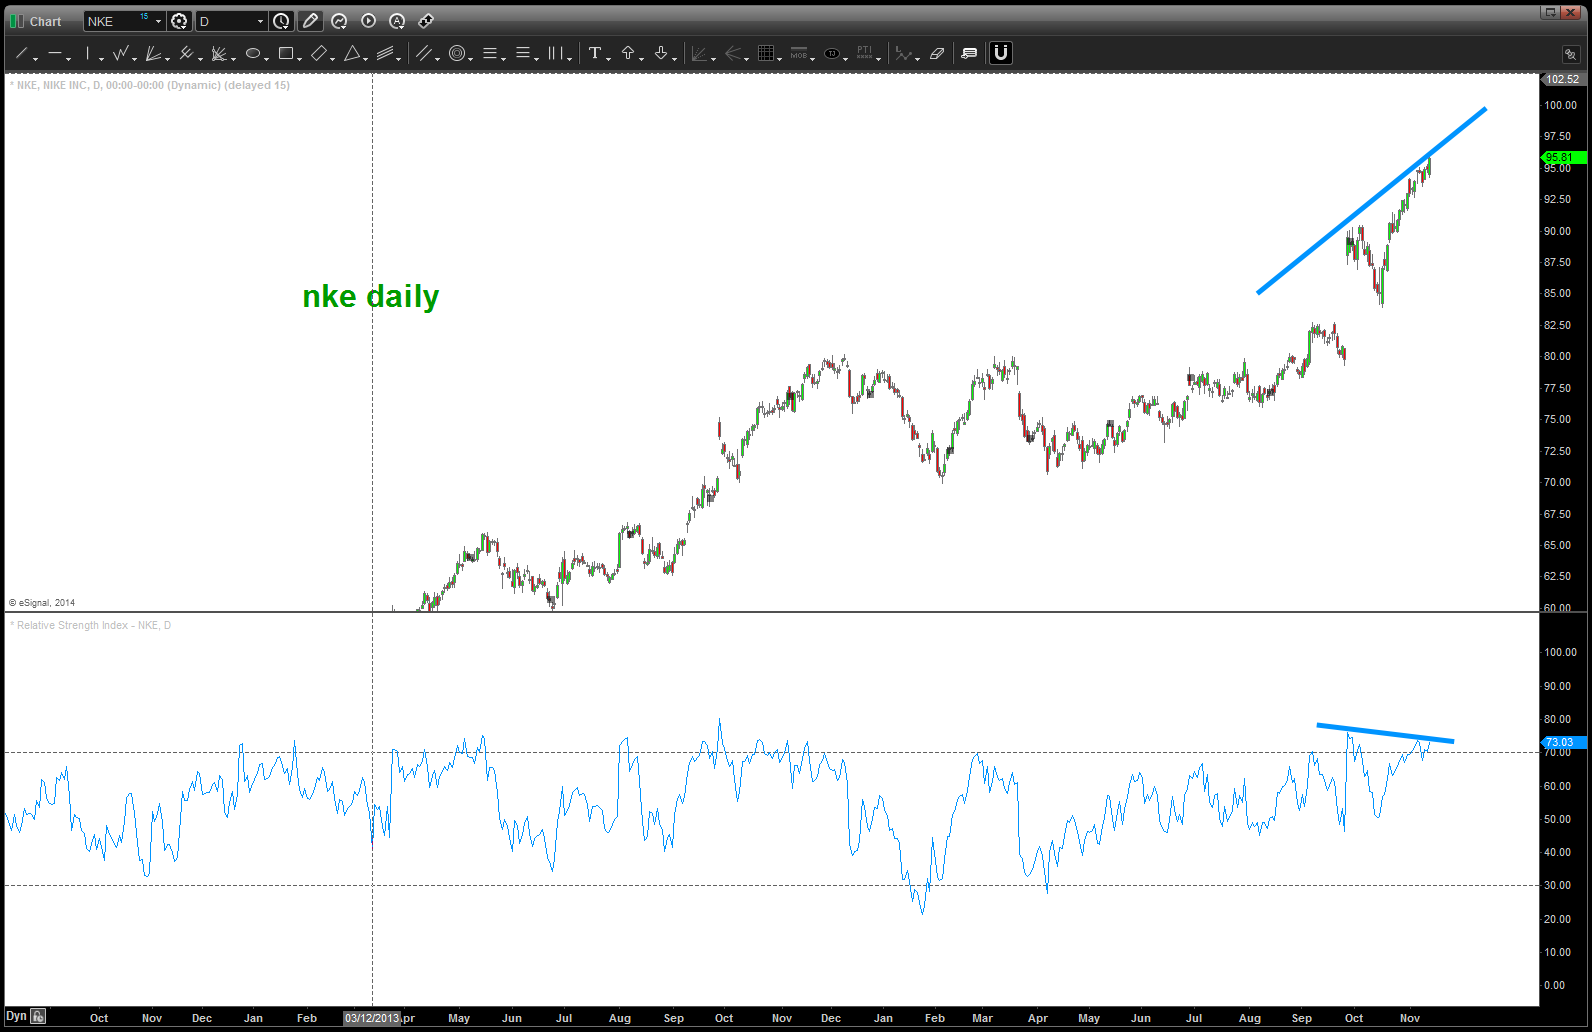
It’s kind of present but not screaming at me ….
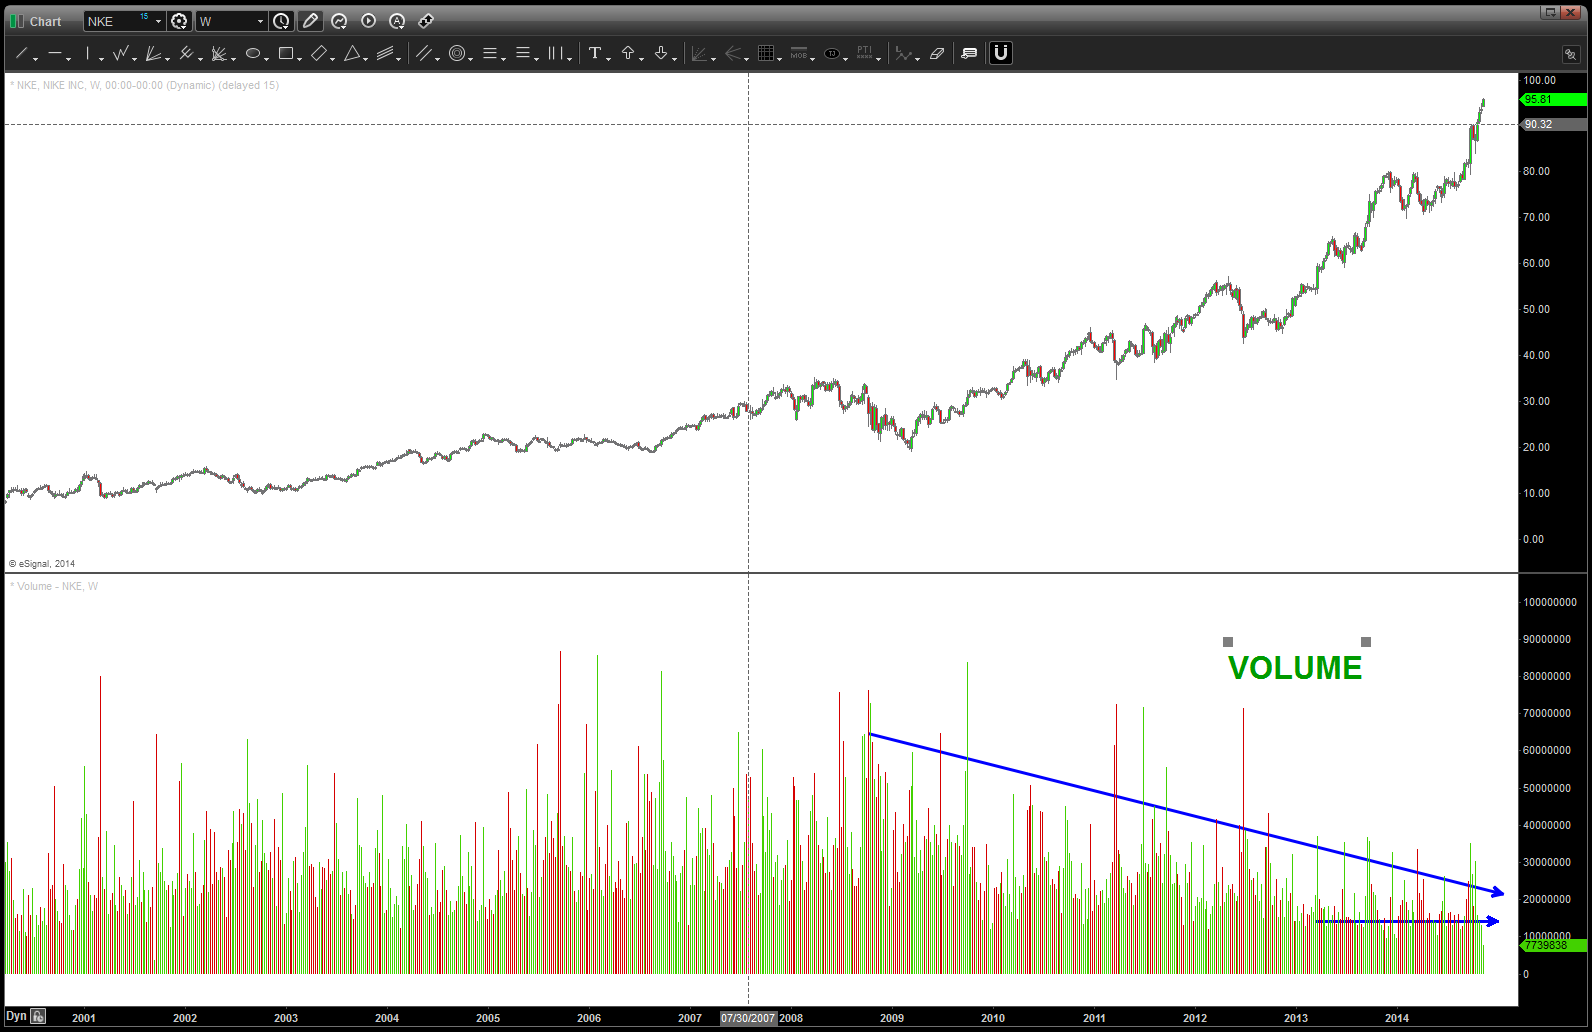
7. take a look at volume – it’s holding in there but note the steep drop off the last 4-6 weeks. hmmmmm
8. one last … threw a 50 day simple moving average on their to look for “reversion to the mean” – basically are we at an extreme from the median of the 50 day? YES ….
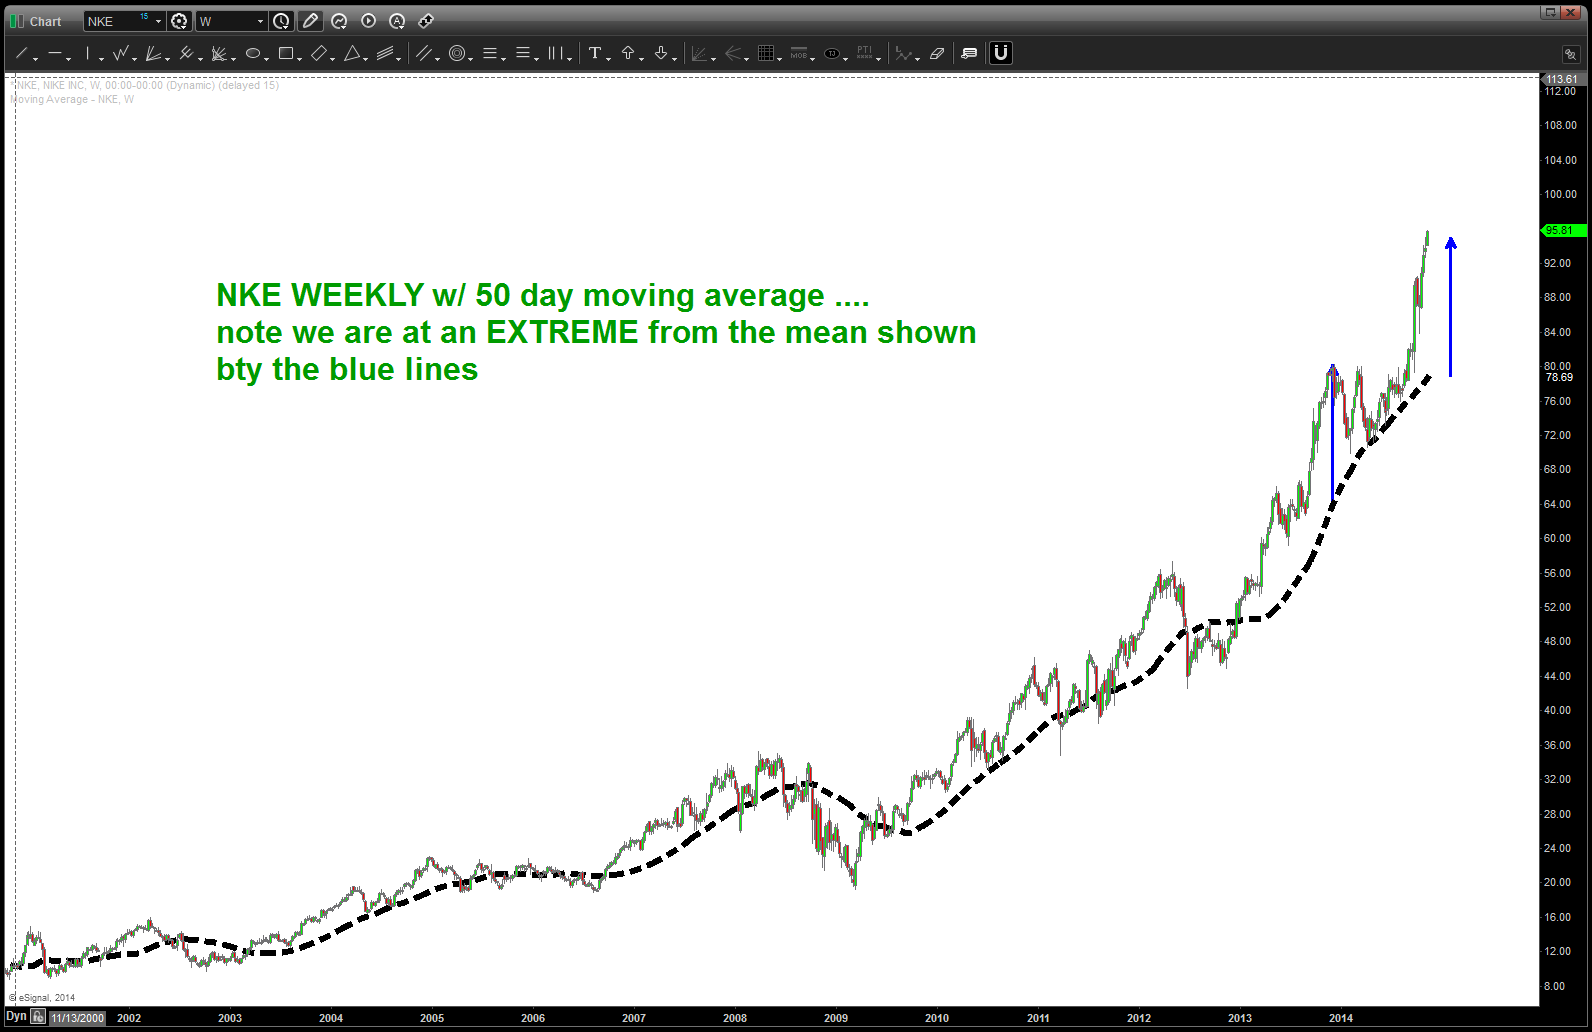
so, in conclusion, we are parabolic and another 10% move up – really quickly – is not out of the question. Believe the first hint of a SIGNAL REVERSAL CANDLE (weekly) would be time to take profits and, remember this is 3 of 5 (if my count is correct) so I will be looking to BUY NKE after the inevitable pull back in any parabolic.
questions to me.
Bart
