Loonie, Confluence, Musical Theory and the Oil Services Index
UPDATE: picture paints a thousand words. NOTE THE HUGE AMOUNT OF THRUST THAT CAME INTO OUR LEVEL. Even w/ that much thrust it only went thru 15 pips. current consolidation needs to get going higher OR pull back a little for this level to be key. Lastly, take a peak at the oil services index below. it has not broken and is holding up nicely. per original thesis below, believe one of them is going to ‘break the pattern’ and move rather strongly .. need to sit tight and watch the show unfold but it’s coming…
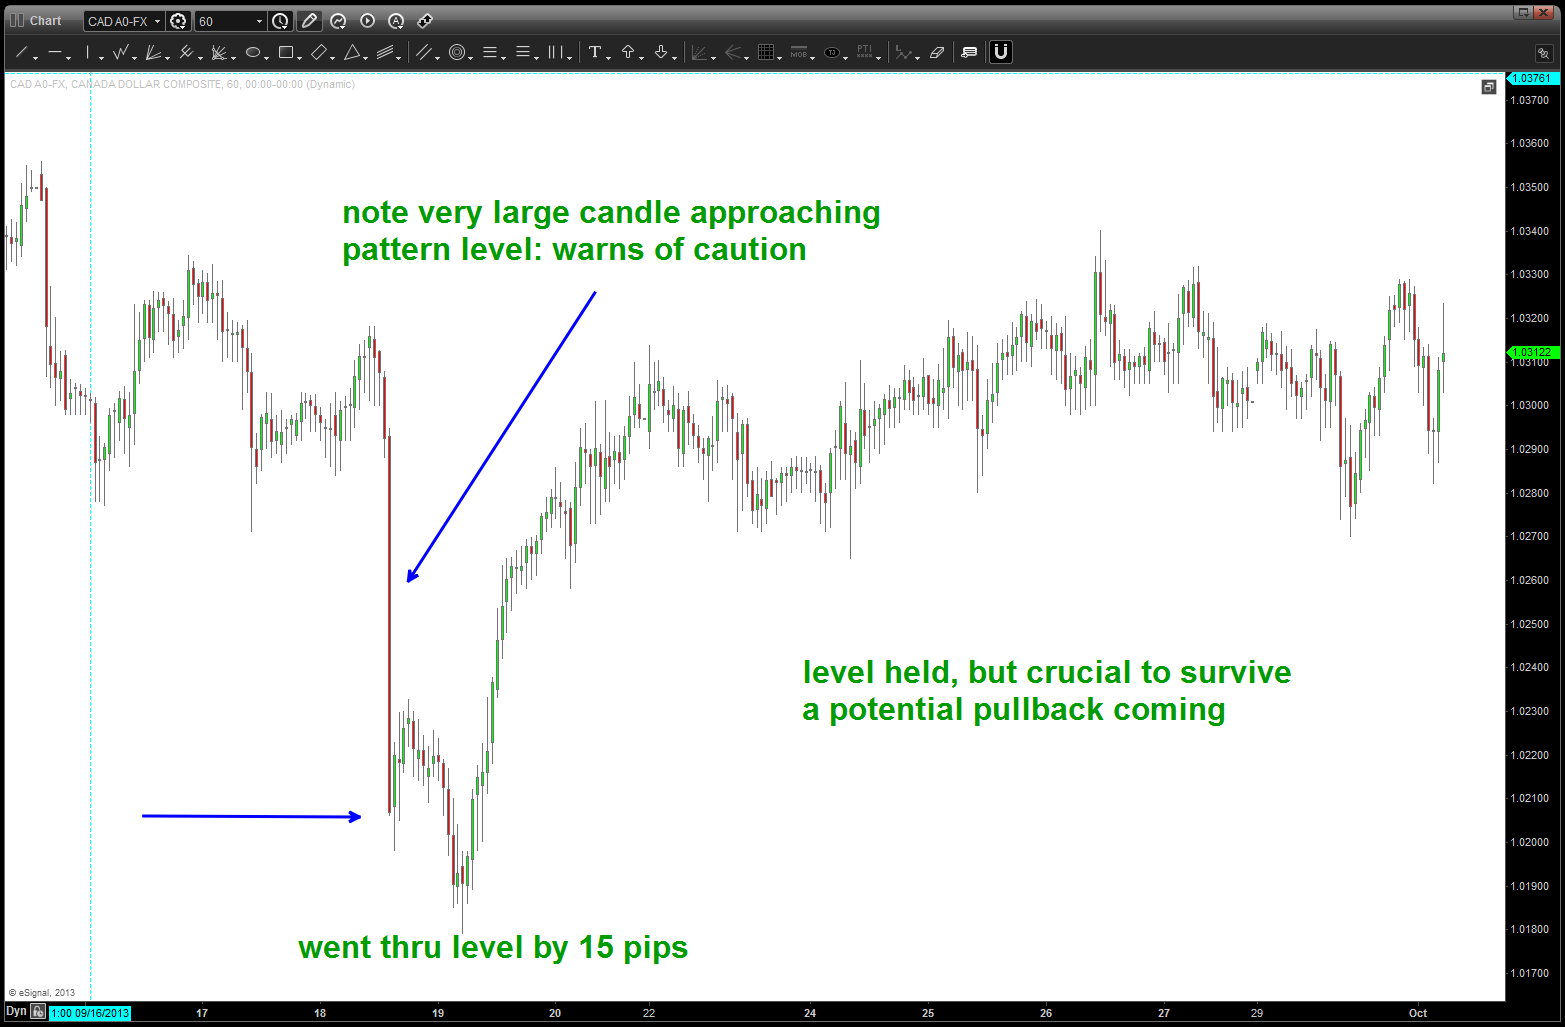
Level held … watch for pullback potential
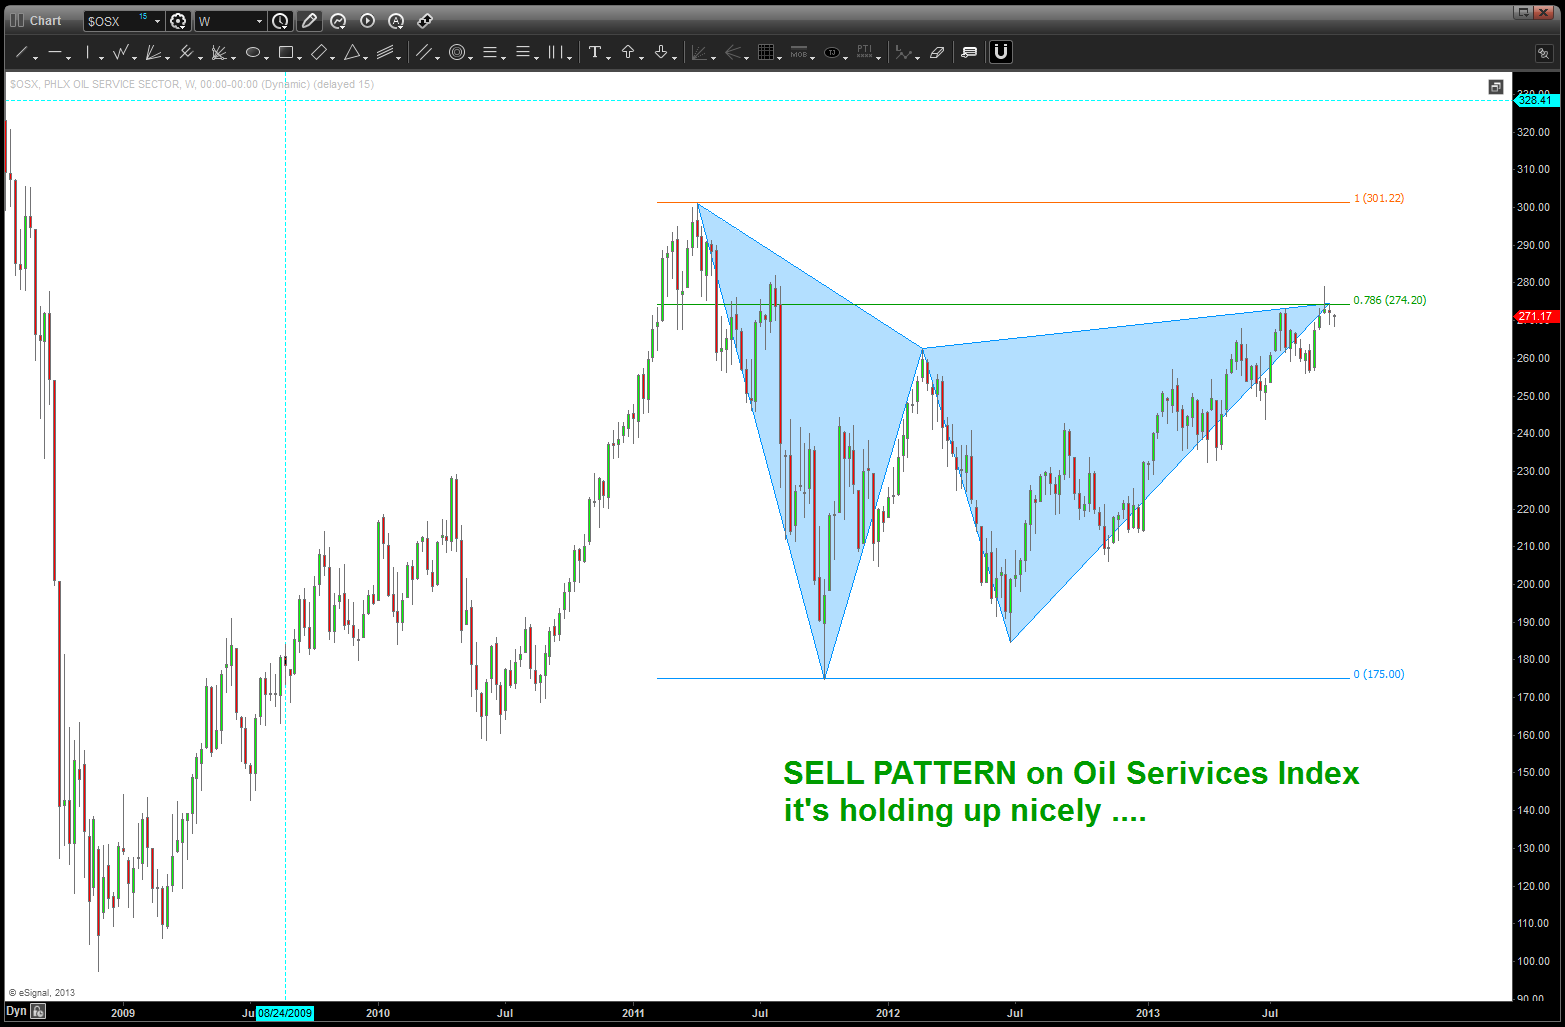
holding nicely
quite the amazing jigsaw puzzle playing out now w/in the Loonie …I’m just trying to put some of the pieces together to manage risk.
one of my mentors and friend is an individual named Mike Jenkins of http://www.stockcyclesforecast.com. he introduced me to many many techniques but what has been most important is why square roots and their inverses are so important …. in his amazing book, the secret science of the stock market, he spends a chapter on Musical Theory. Much more could be said and I’ve gone down that enjoyable tunnel but here’s the basics:
- the frequency of a string is inversely proportional to the square root of its weight/length
- directly proportional to the square root of it’s tension.
- the equal octave scale ratio used is the 12th root of 2 (2^.0833) = 1.05946
- 1.05946 is used as the primary tonal increment and give us numbers that march us UP and DOWN the equal octave scale
so, there’s our musical theory. here’s a chart taking the low (2003) of the SPX cash market and simply multiplying by 1.05946 12 times and that 12th note EXACTLY nailed the top. study the chart and enjoy
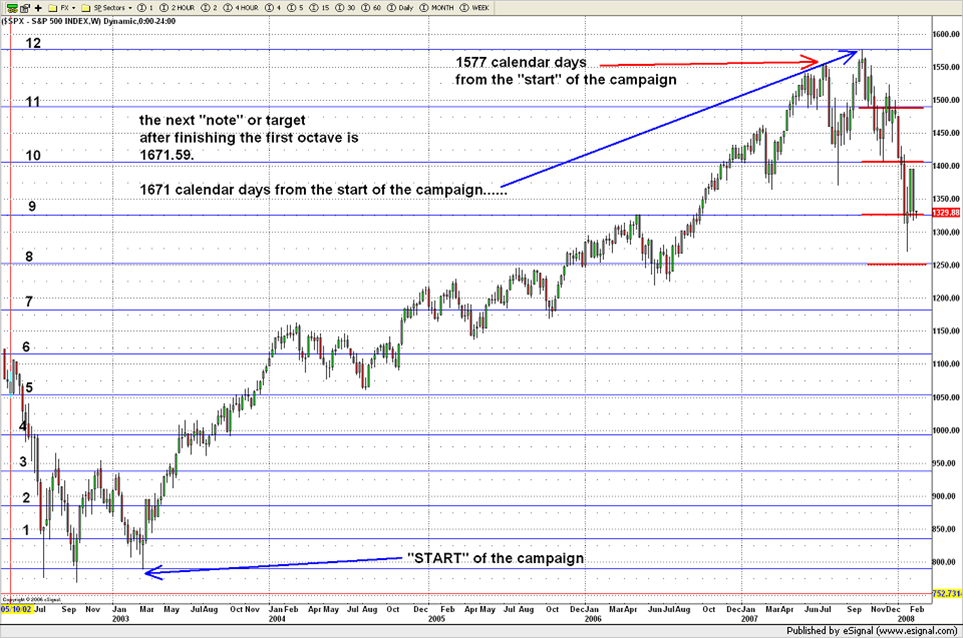
tonal increments from the 2003 low and the top in 2007 for the S&P cash
here is some more math to noodle on:
1.618
square root of 1.618 = 1.27
1/1.27 = .786
square root of .786 = .886
1/.886 = 1.128
here is the current chart of the loonie (4 hour) and the ratio’s that it’s bouncing around:
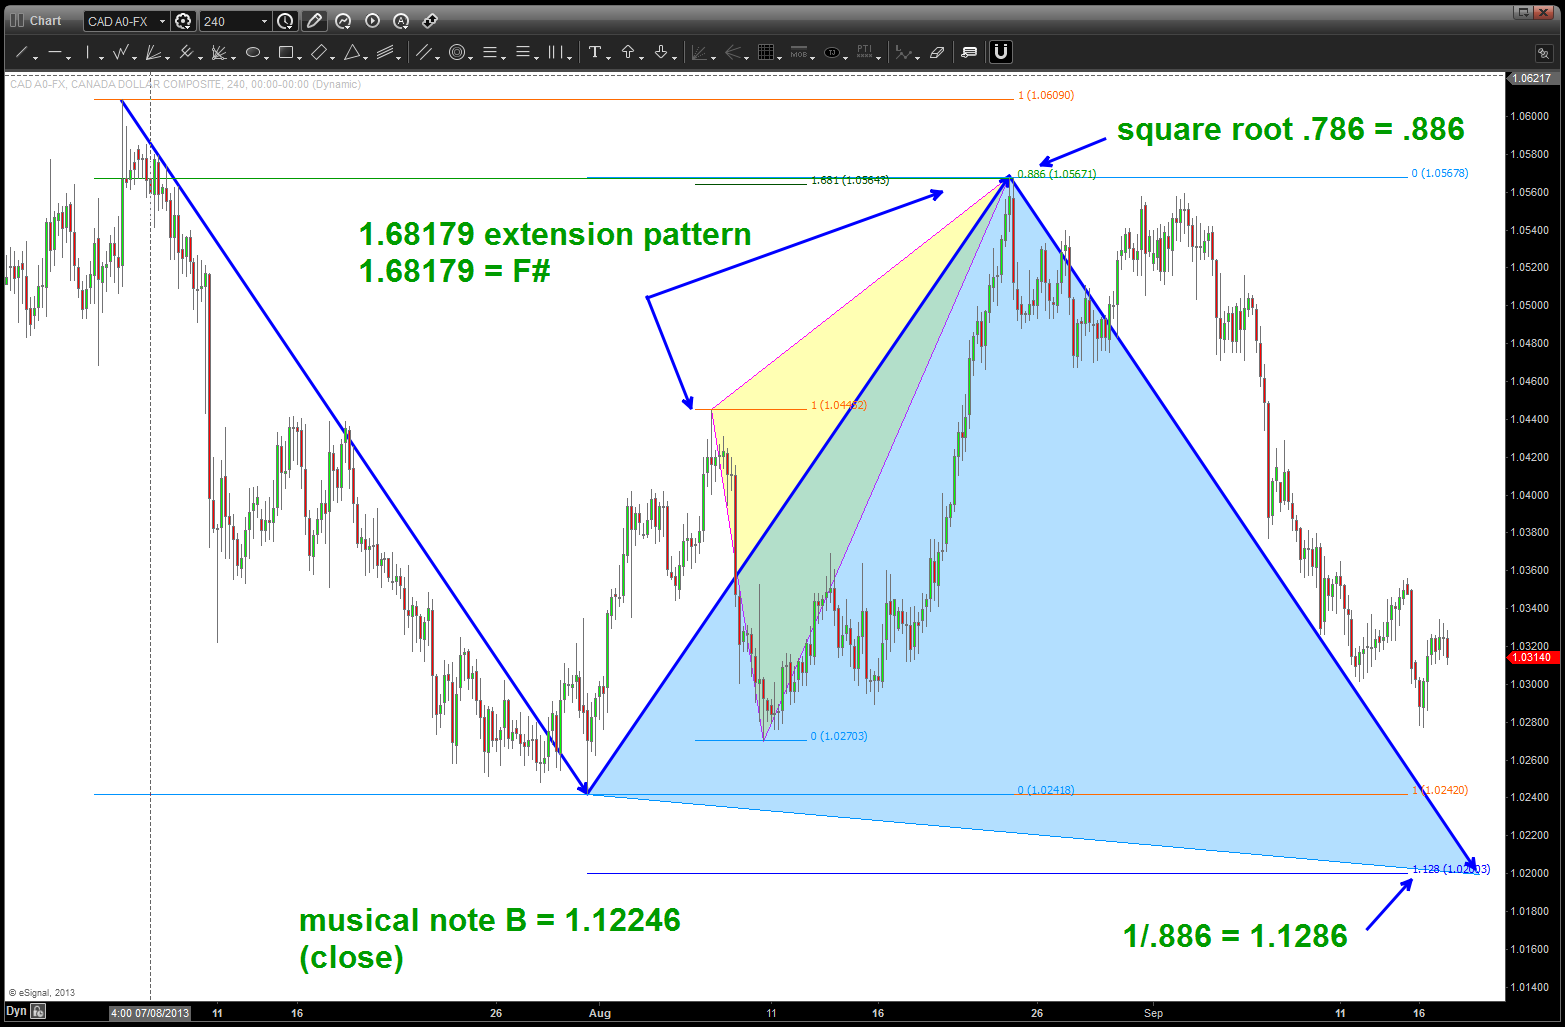
note all the different ratio’s that are based on square roots and their inverses
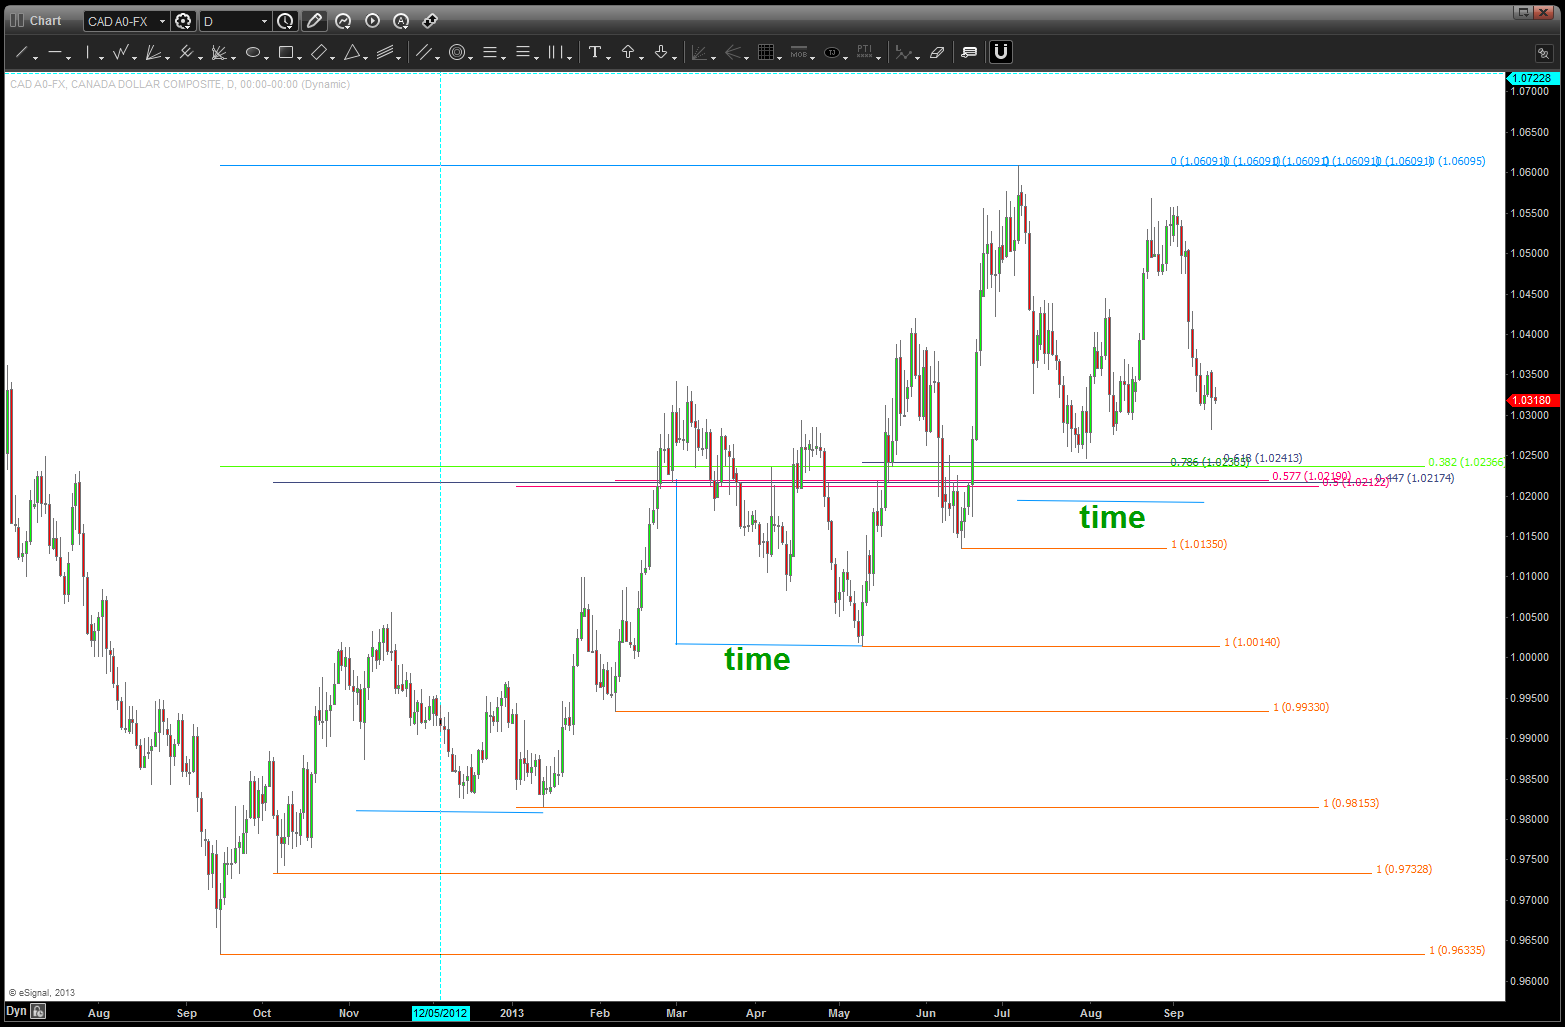
in one of my last posts we discussed the confluence level that was broken at the 3600 handle on the NAZZIE. Today we are going to look at a “daily” chart of the Loonie and note w/in a 20-30 pip window we have .382/.447/.5/.577/.618/.786 retracements all coming in w/ 1.0210-1.0240. additionally, we have a measured move (or ab-cd) coming in w/in those levels and the extension (1.1286) is right along w/ the above discussion (diatribe?) on music. additionally, look at the “time” component of the corrections that have occurred for the past year – they have been pretty symmetrical and we are basically “there” w/ regard to this correction in the Loonie vs the USD being complete. for those wondering where the .577/.447 came from see above … take the numbers 1-5, their square roots and the inverse of those square roots …. anyway, here’s the picture of the confluence level on the LOONIE vs the USD
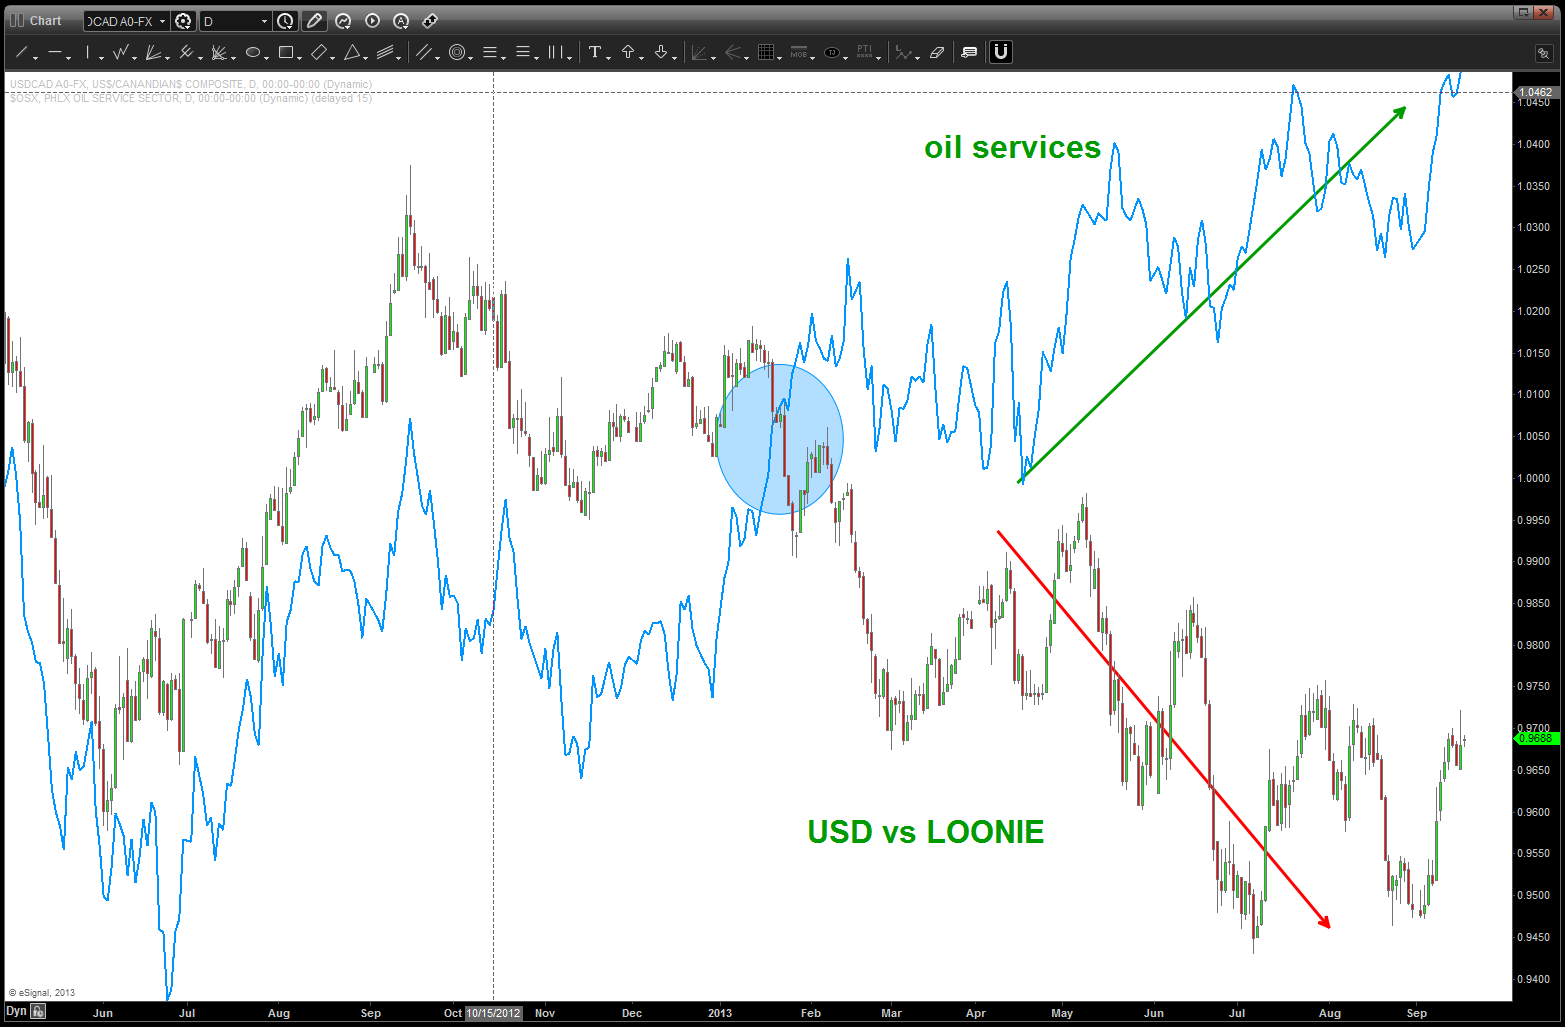
so, this is an interesting set up … but if you have been following my posts (or, hint hint, go back and read em’) you’ll see that we are watching the “energy” complex for hints of a directional move and have related that to the SPX because energy (right now) is 10% of the index. well, take a look at the relationship between the LOONIE and the Oil Services Index (the $OIX) is pretty much the same relationship.
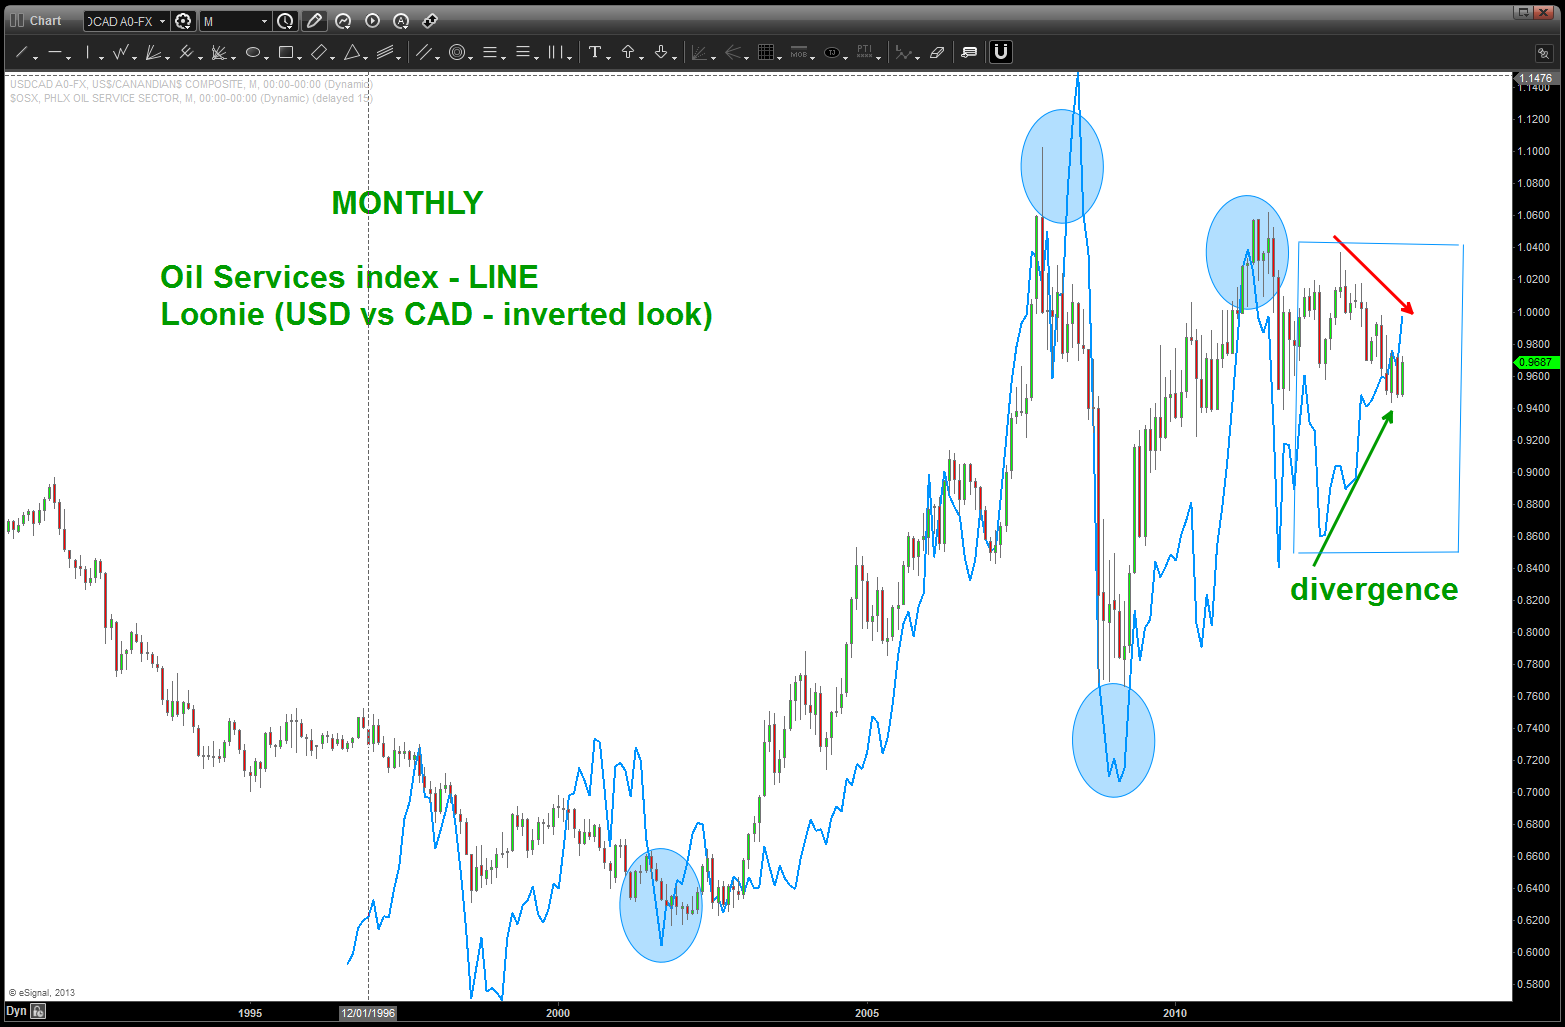
first off, in order to synchronize the “picture” I have inverted the normal picture of the LOONIE and we plotted the USDCAD versus the “normal” CADUSD. that will give us the picture that syncs w/ the oil services index. below is a daily and monthly chart — the daily is showing a divergence that usually doesn’t happen. note how the oil services index has trended higher while the loonie has weakened. that usually doesn’t happen and I have noted where the divergence occurred w/ the blue shaded oval. The other chart is a very long term chart showing how synced these two SEPARATE markets have been.
Now, here’s the interesting part of the crossword puzzle:
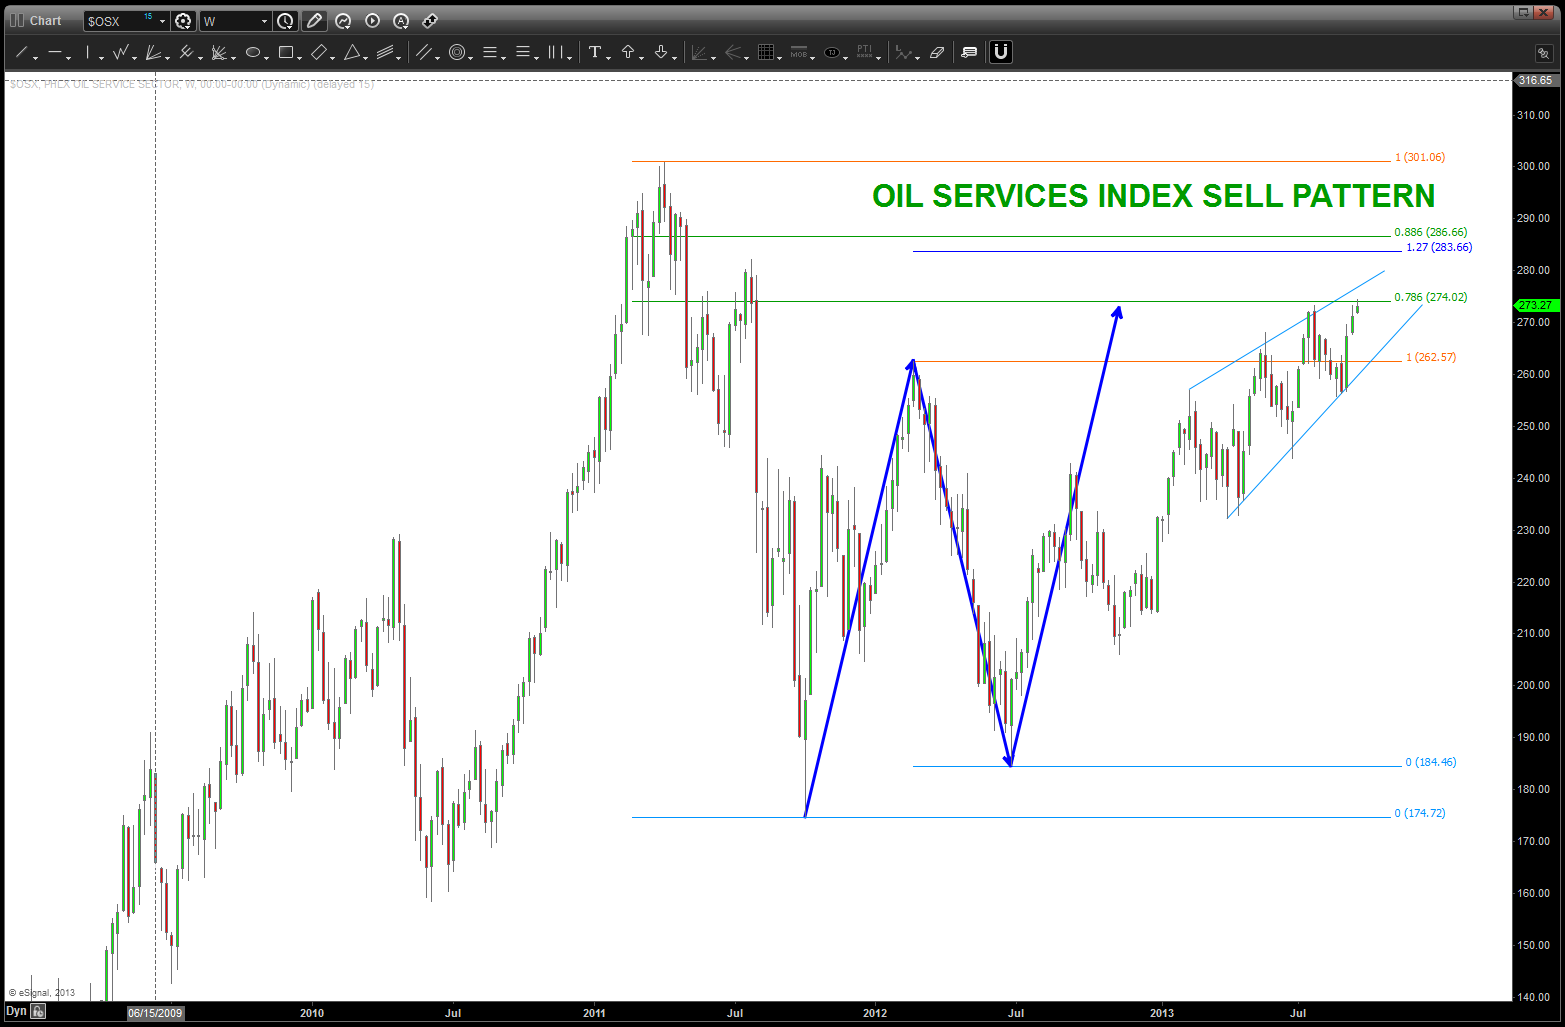
Oil Services SELL pattern here or a little higher
as you can see, we are at a very crucial level w/ the $OSX.
my puzzle fits together IF this happens – the LOW we are looking at w/ our confluence levels (BUY USD vs LOONIE = USD strength) holds AND we have current or higher levels hold on the Oil Services Index work as SELL and the two markets have synced and away we go …
this is the power of intermarket analysis using pattern recognition. we know, beforehand EXACTLY what our risk is going to be, we have a script to follow and can WAIT and see how this plays out … as an intermarket pattern recognition trader I love when separate markets that are usually synced come together at “PATTERN TIME” (note: not hammer time) and give us a nice clue. Seldom do they continue to diverge….
waiting, patiently –

I see a lot of interesting content on your website. You have to spend a lot of time writing, i know how to save you a lot of time, there is a tool
that creates readable, google friendly articles in couple of seconds,
just type in google – k2 unlimited content