The circle of life … October 11, 2026

10/11/2026 or 111 1 …. 😉
When I taught CMT (i) Level III I used to call the circle of life a dance of commodities, currencies, fixed income and equities …one of the best books on technical analysis and the ‘intermarket’ is “Intermarket Technical Analysis” by John Murphy. Must read and understand.
The power of the PATTERNS is we see patterns emerging which help one to strategize and, potentially get out in front of the market rotation. As in, one is already positioned before the ‘general public’ gets in … unfortunately, patterns make you inherently contrarian.
Take the following two media posts:

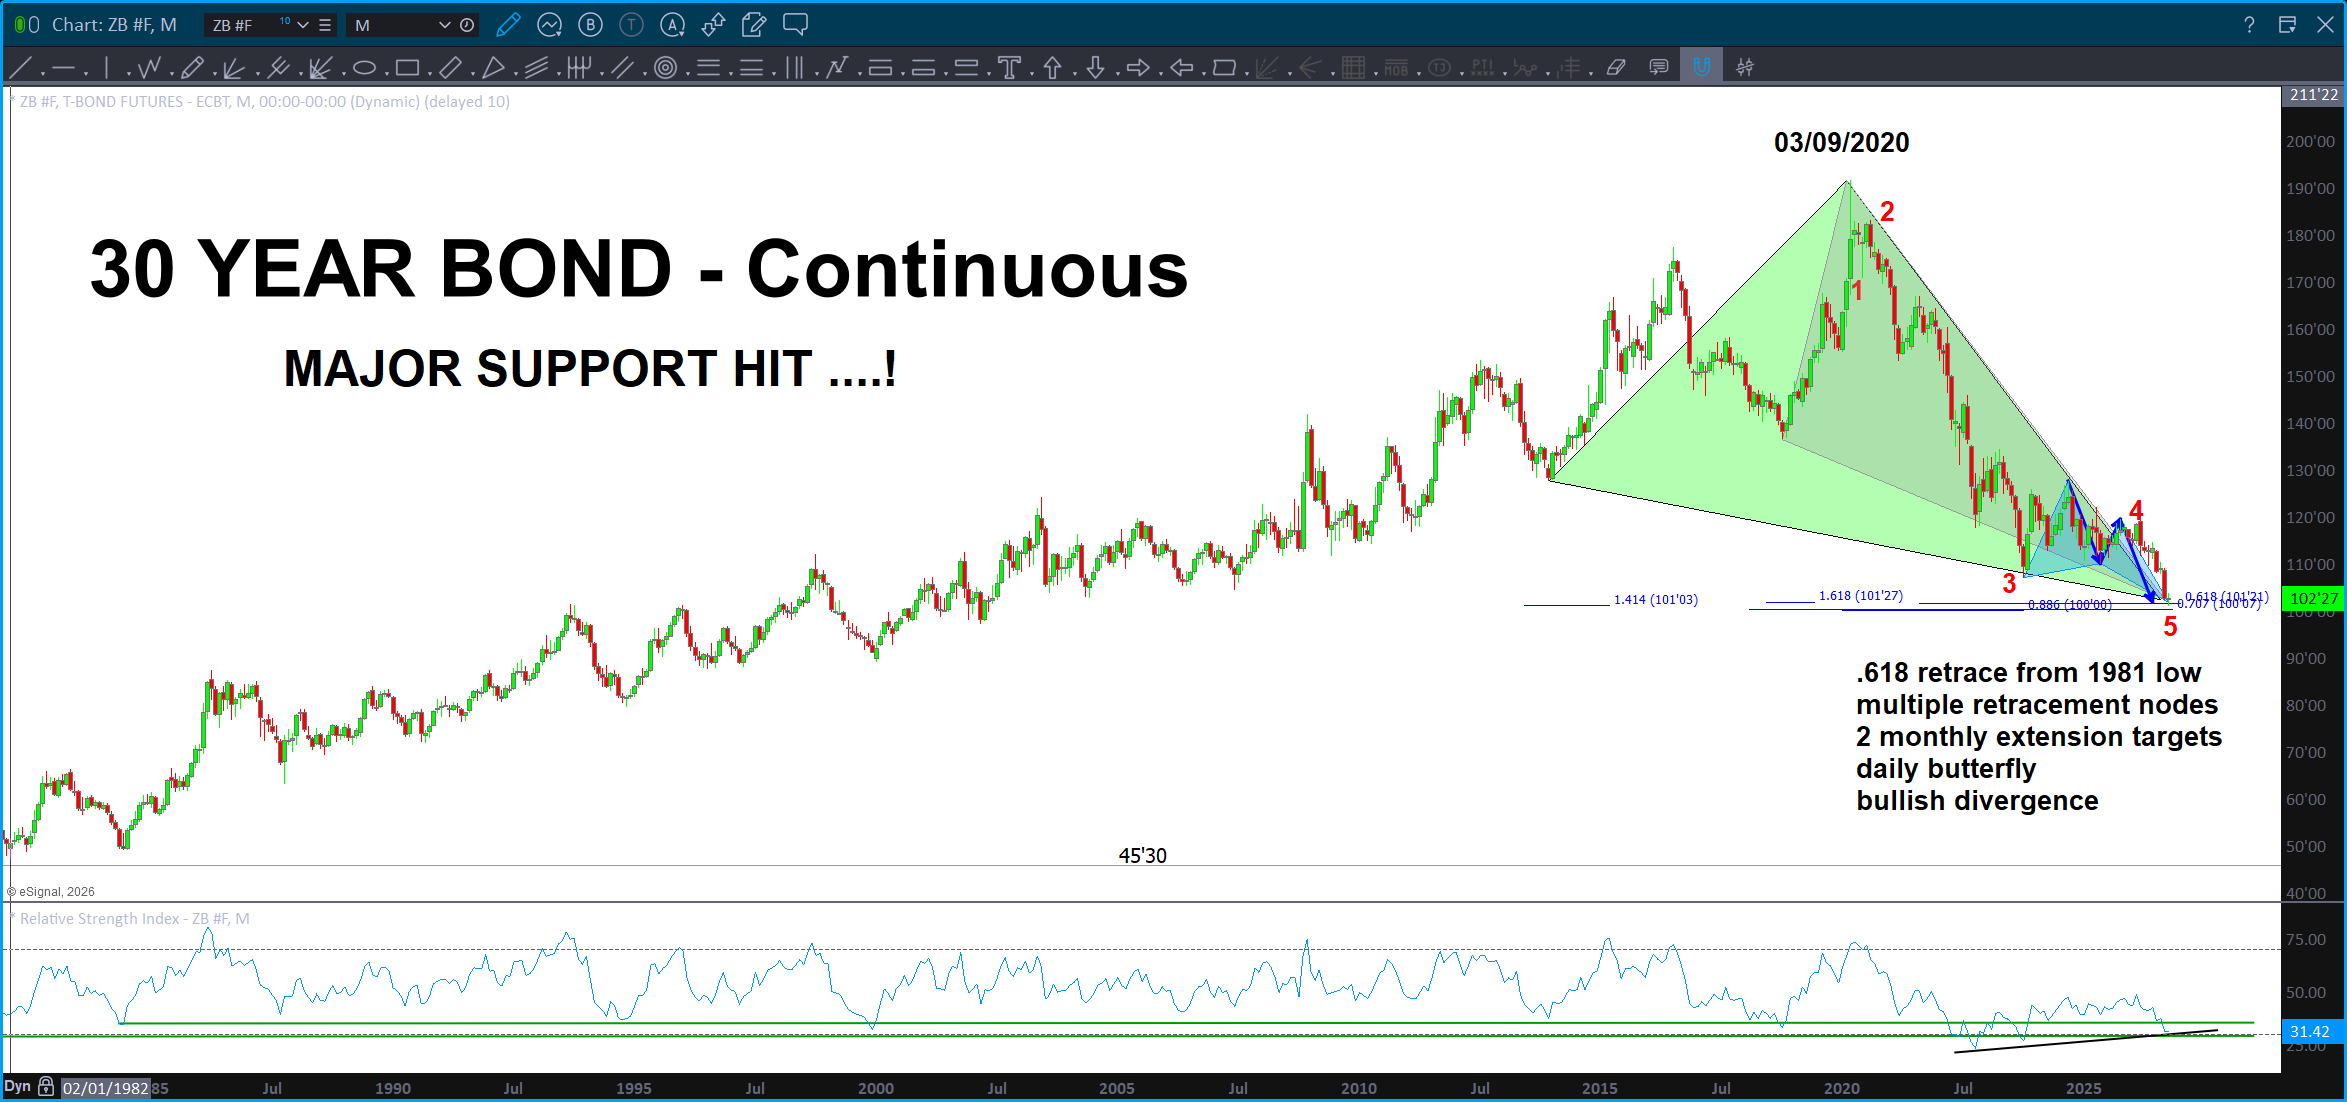
As the world is screaming the end of the US Bond Market … we have very important ratio’s and patterns all converging in/around the 100-101 level on the long bond – continuous contract. (Note if a futures trader that price might be off a little for the front month). So, Bonds have bottomed or are about to bottom. This will be a multi-month to a year bounce.
If we blow thru this level and keep on trucking lower … something definitely ain’t right at the Circle K.
How about AI and the semi-conductor index …?
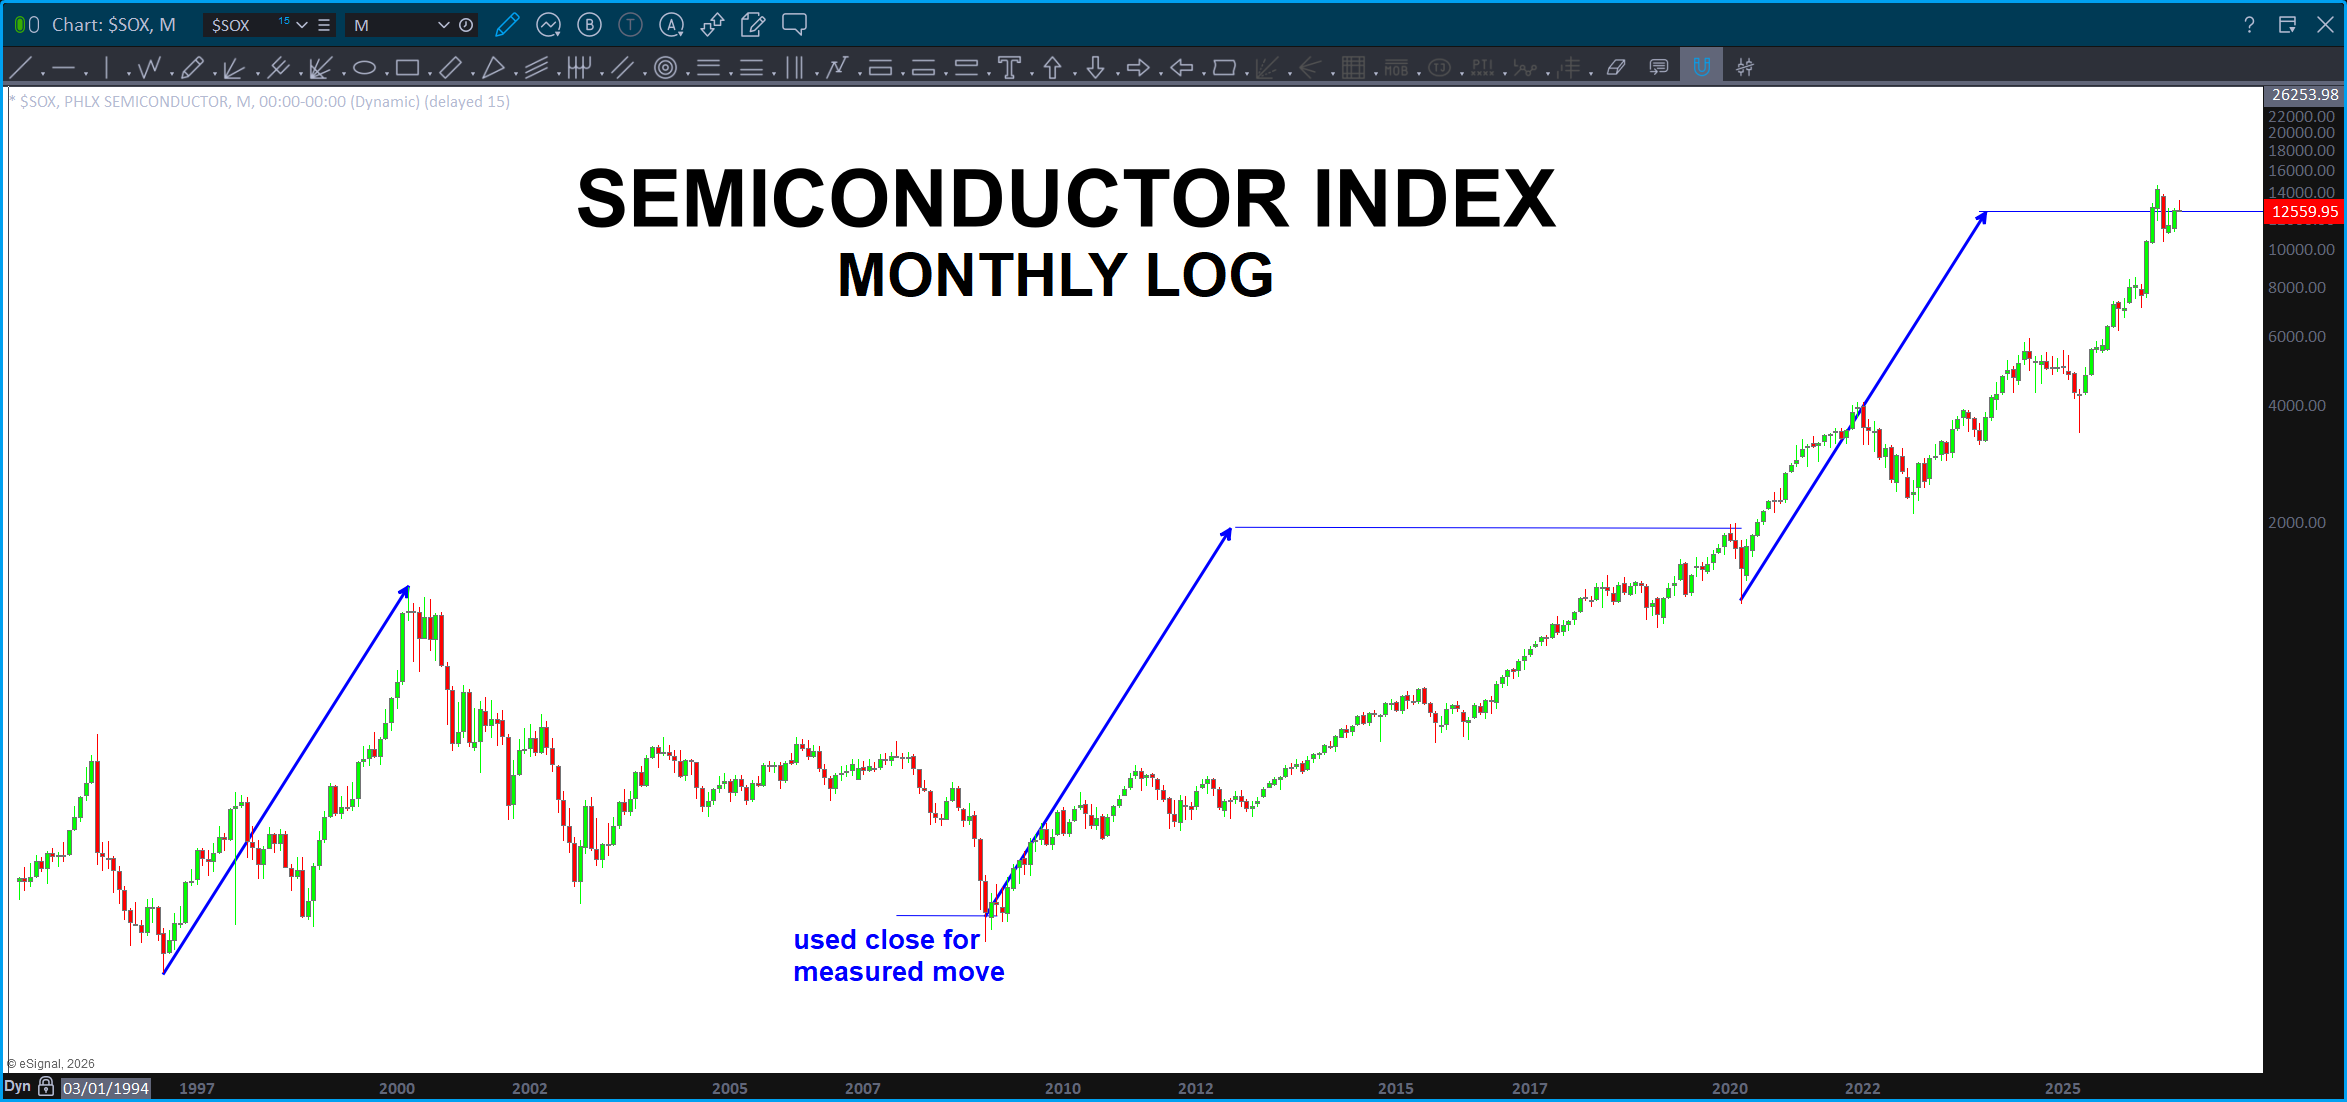
Log scale above … we exceeded the blue measured move a little bit at the all time high but check out what just happened:
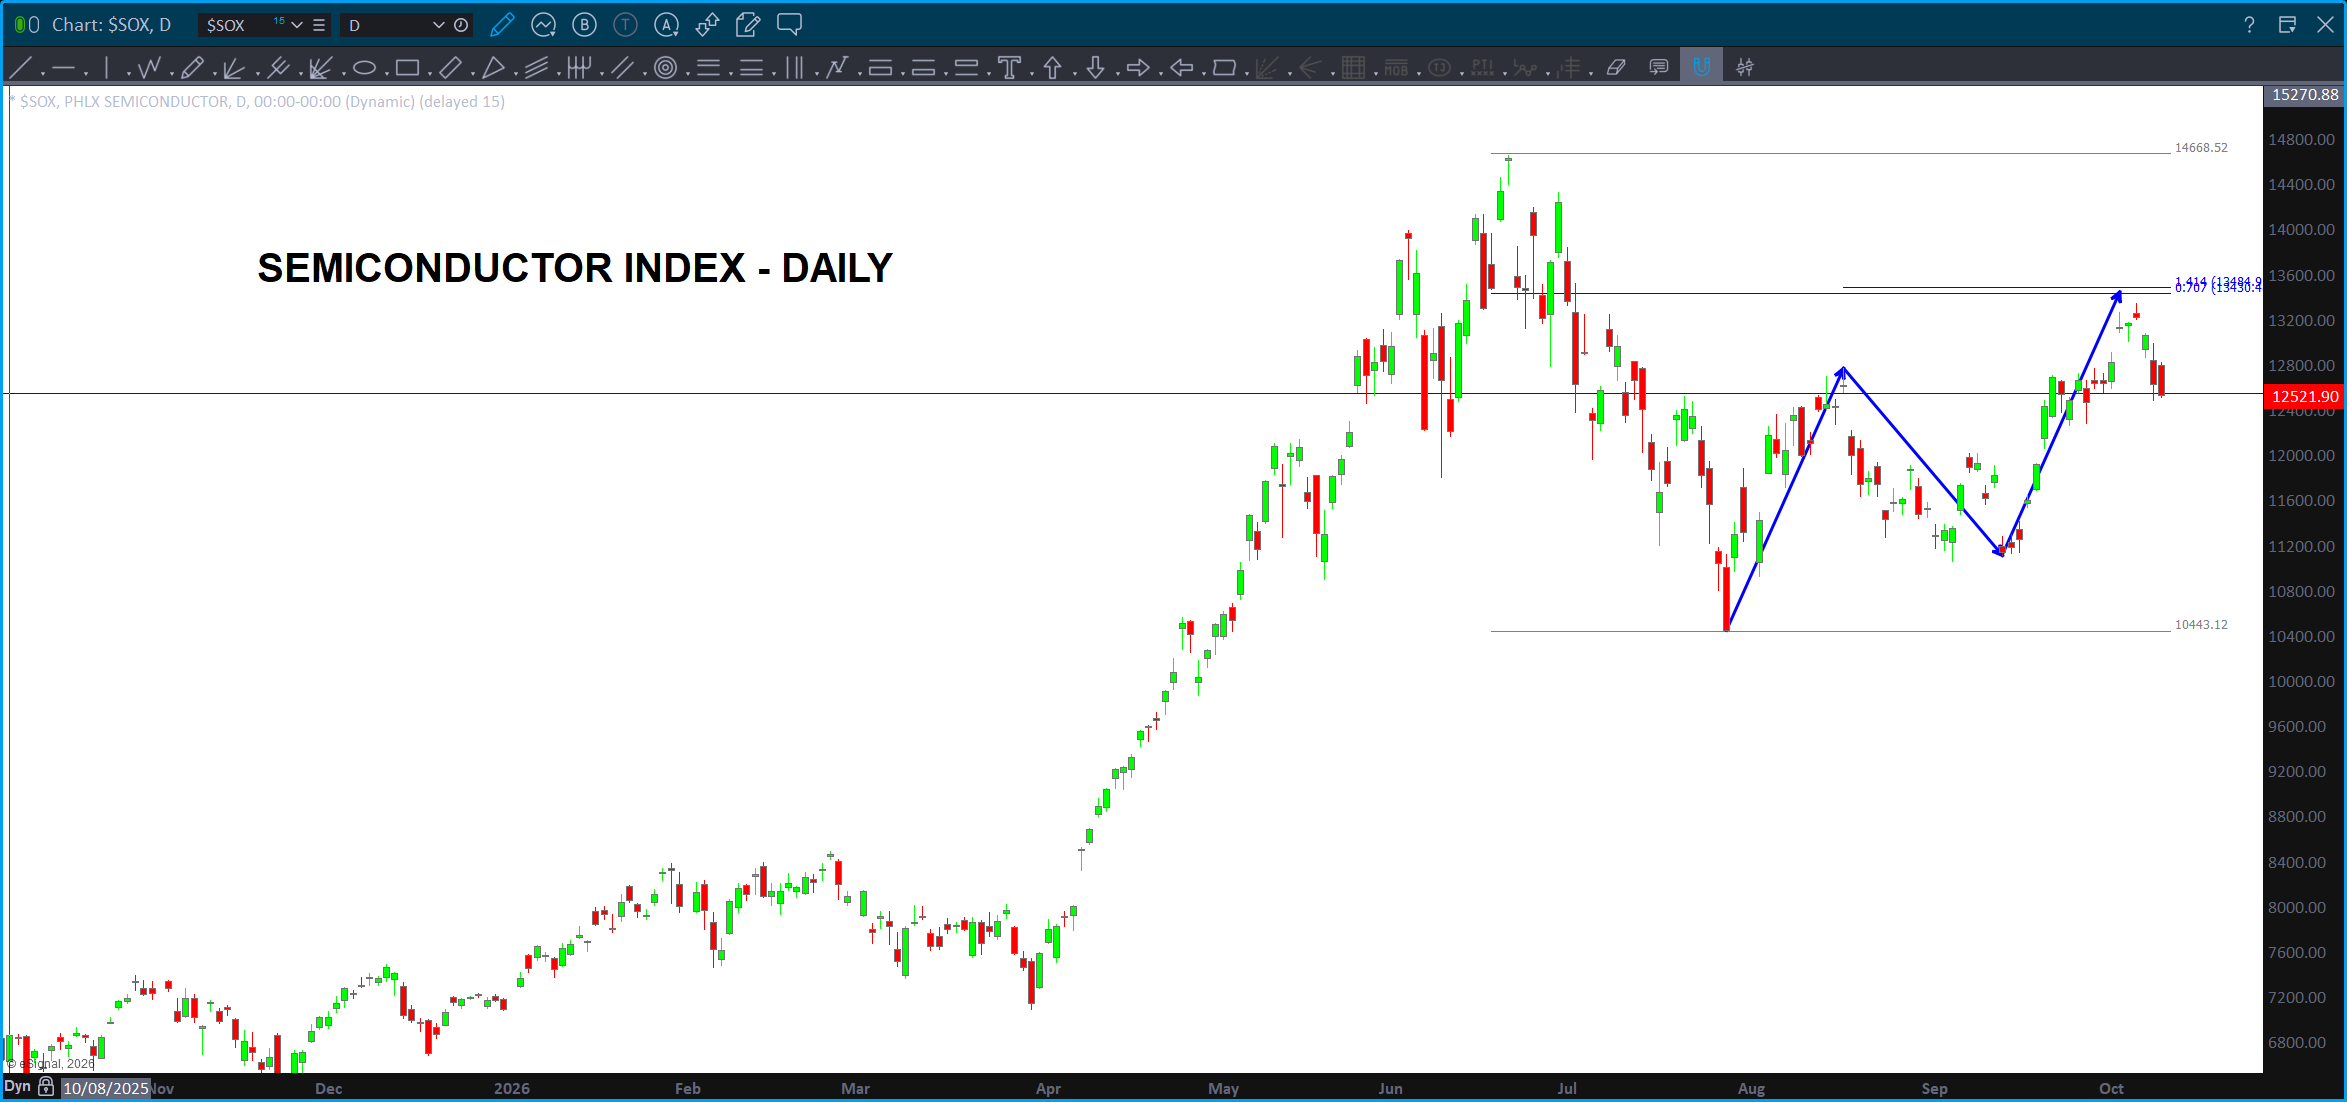
This, folks, is the near perfect SELL PATTERN. So, AI and the semi-conductors have topped for now …? Who believes that? It’s simple – trust the patterns. For now, the secondary high is our line in the sand. Above that and the trend continues but adding the log measured moves and now the near perfect daily sale signal – expect resistance/selling in this sector.
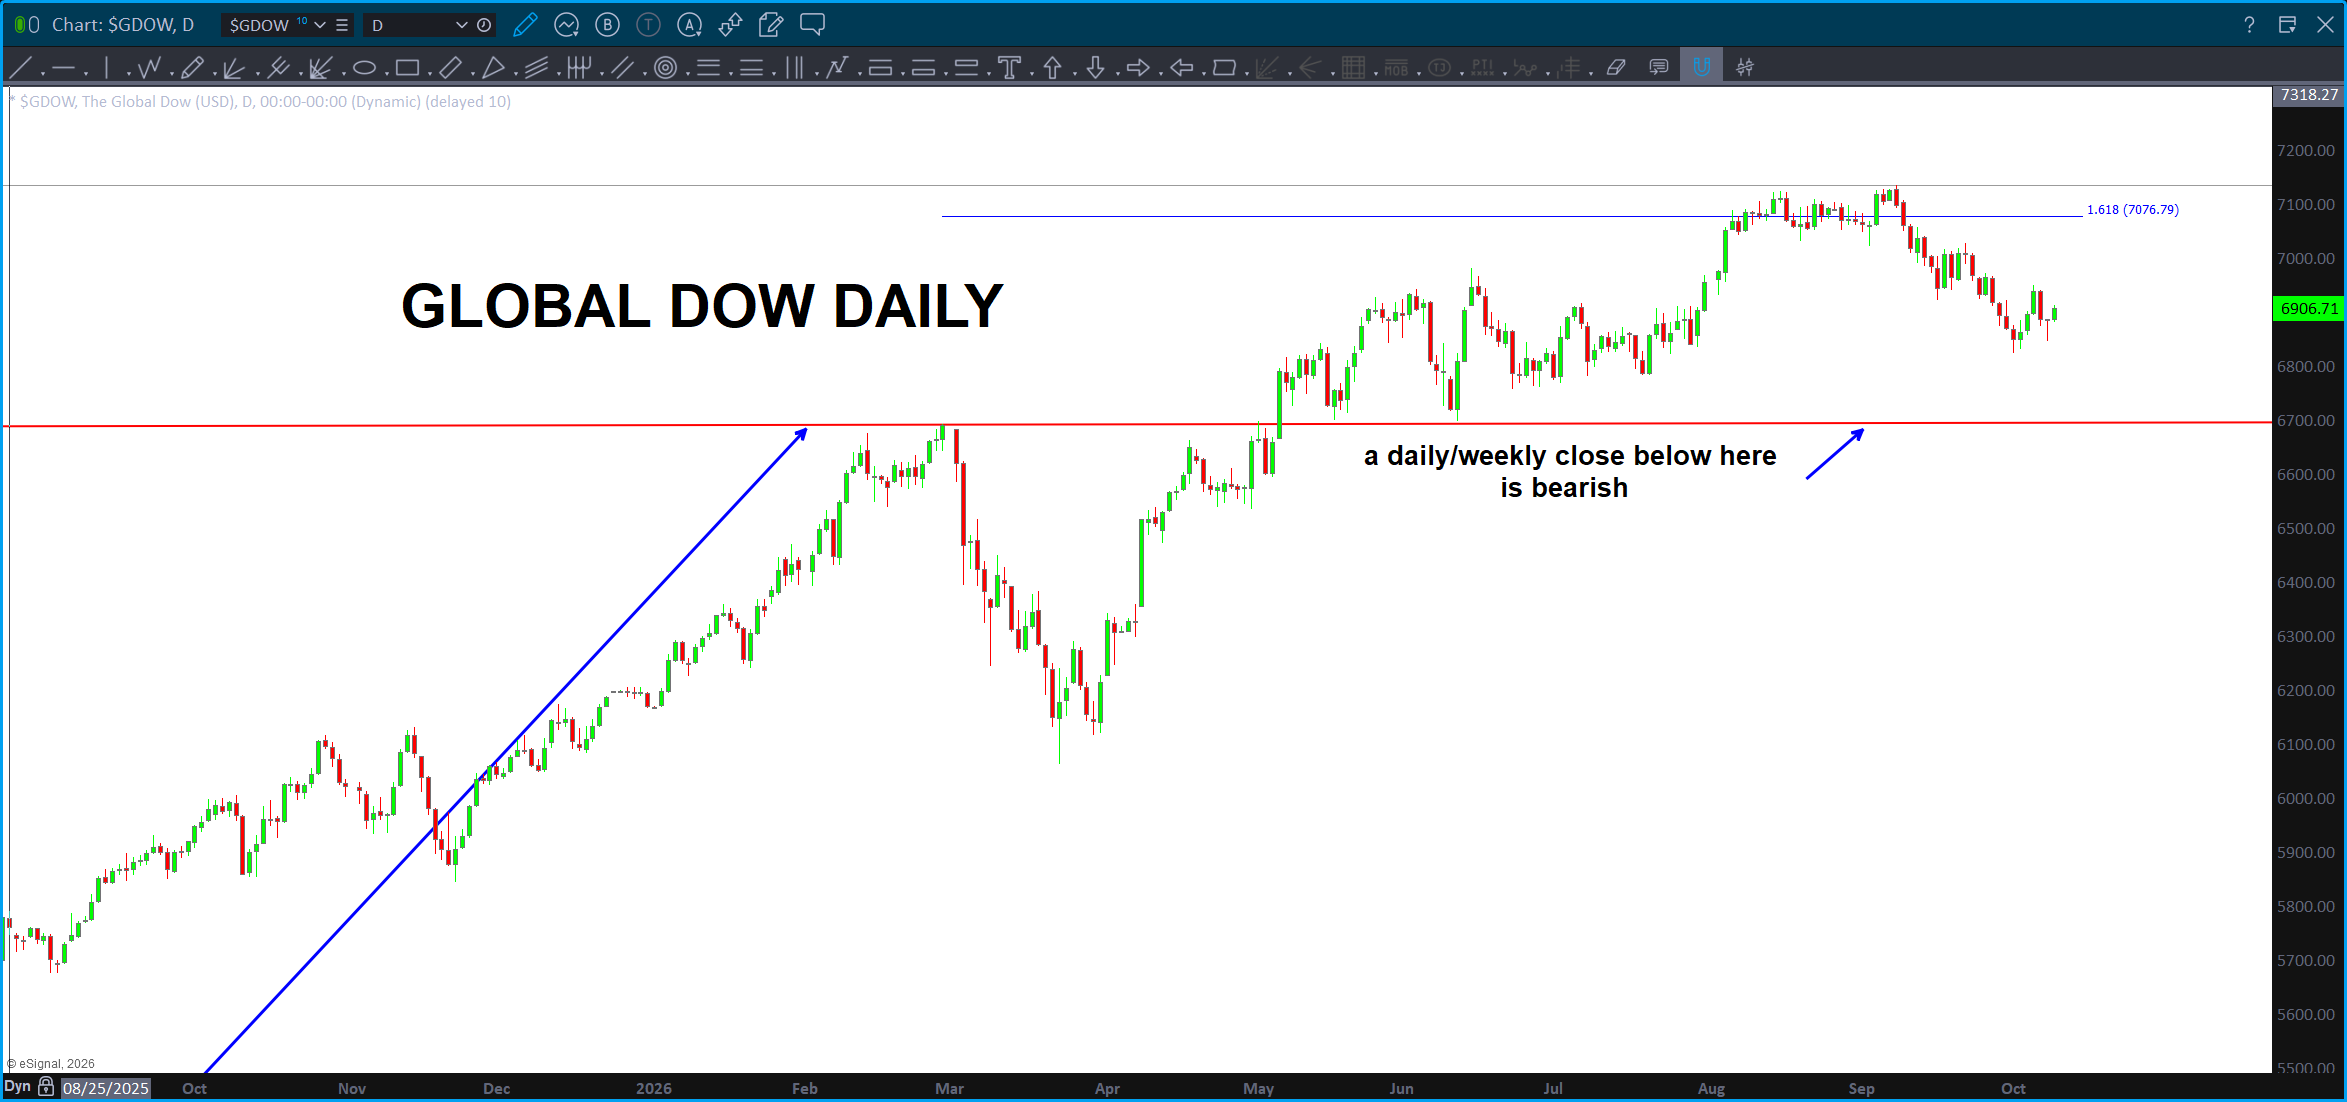
Here’s the Global Dow after hitting a Euler Number projection: Euler’s number, e ≈ 2.71828, is the mathematical constant that describes continuous growth: it is the value a quantity reaches when it grows at a 100% rate compounded at every instant over one unit of time. Because so many natural and financial processes change in proportion to their own size, e sits at the foundation of compound interest, population growth, radioactive decay, probability and statistics, and the calculus used throughout physics and engineering.
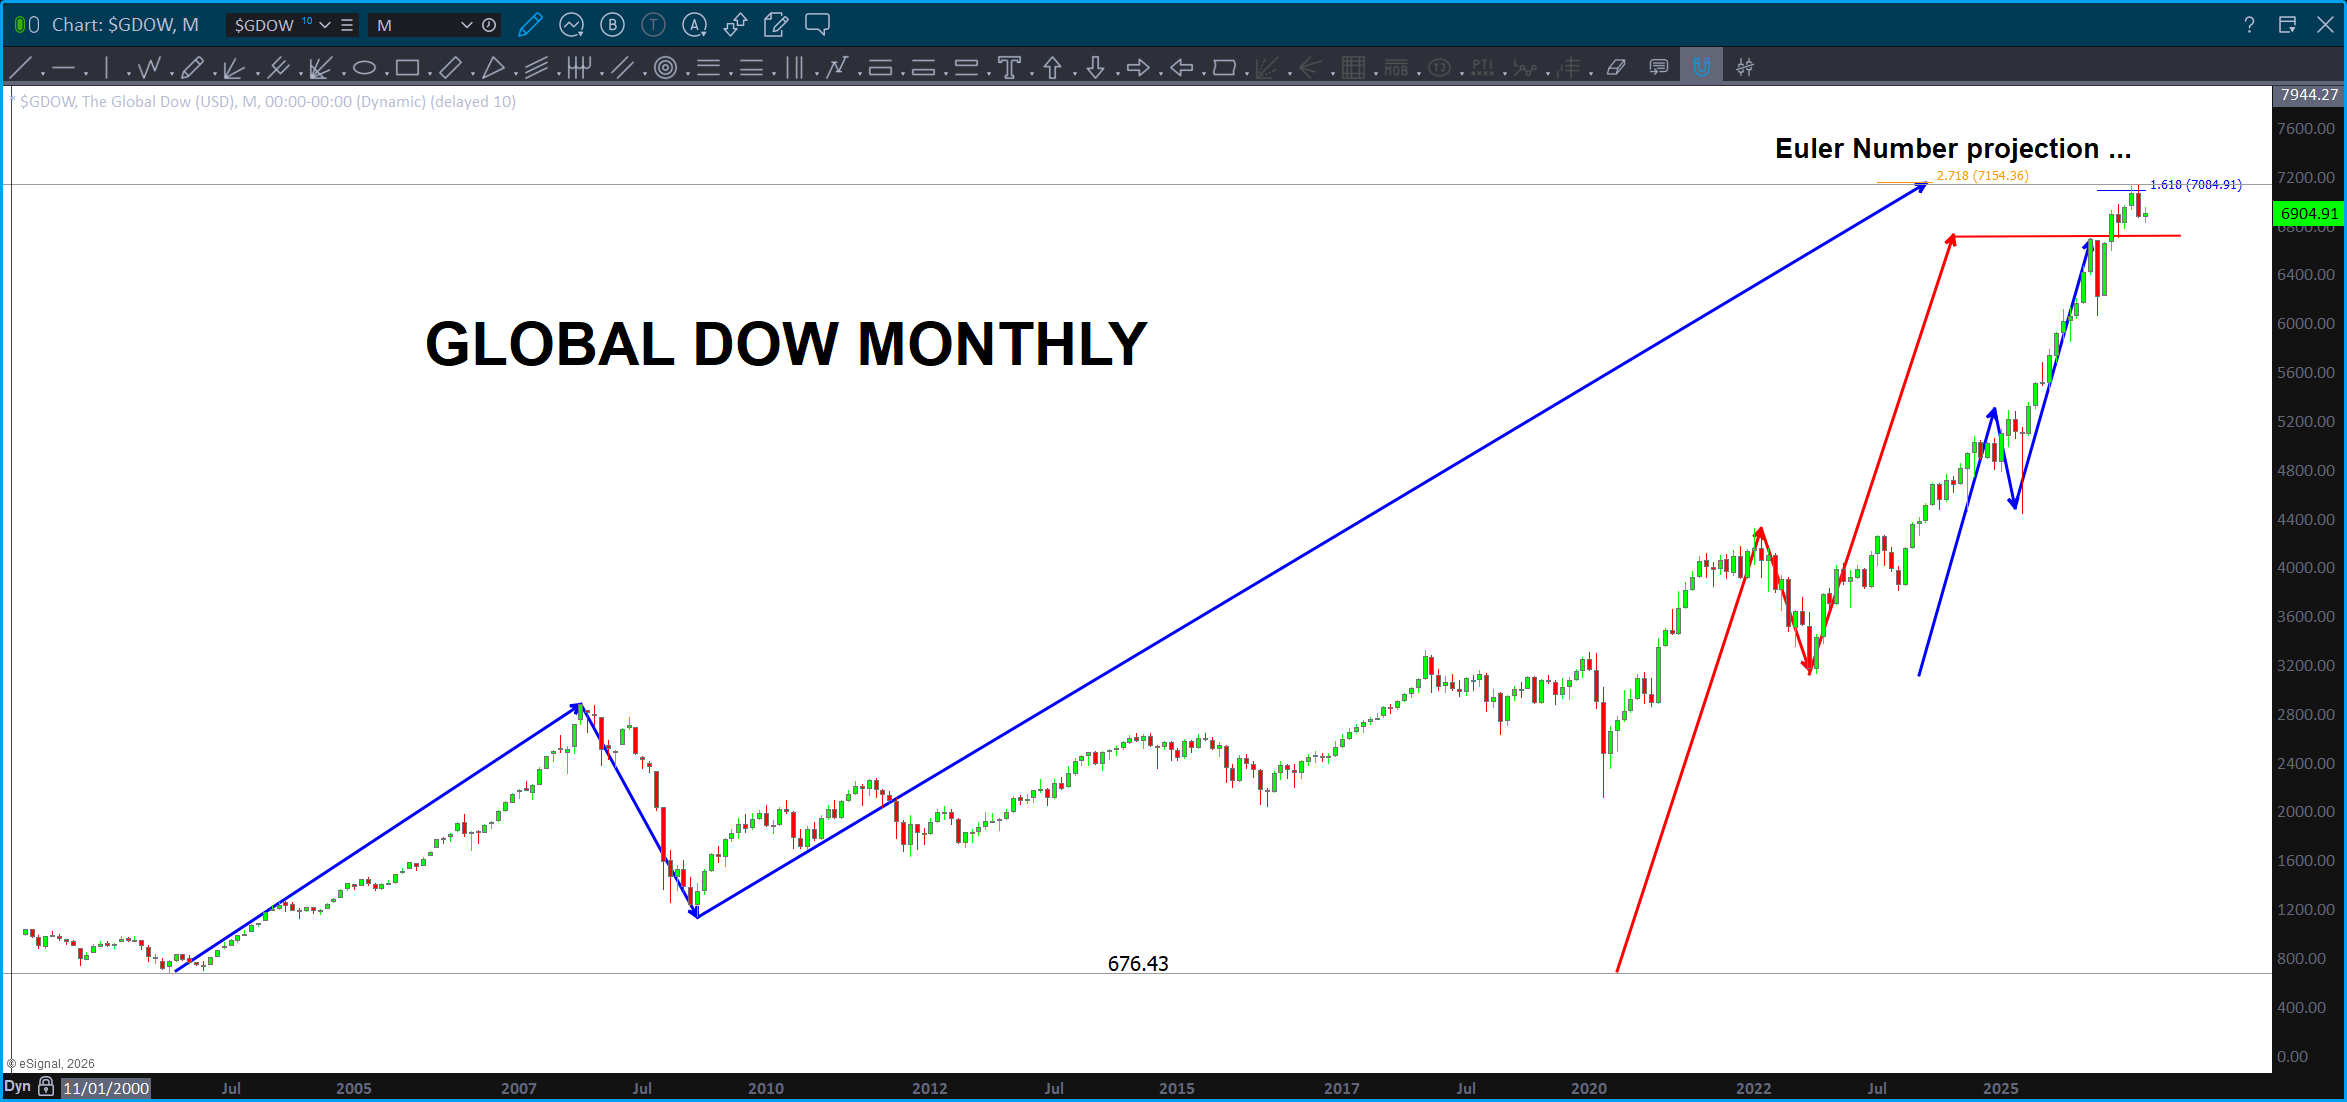
The big thing that I want to show about this chart is the fact that it ‘blew thru’ two nice projections so, to be ‘bearish’ I would watch out for a daily/weekly close back below the red line. Right now, we can see ‘why’ the Global Dow hit resistance 1/ the Euler number projection and 2/ the 1.618 extension from the daily below. So, watch a close below this red line (below) to become bearish or, expect a nice correction ahead.
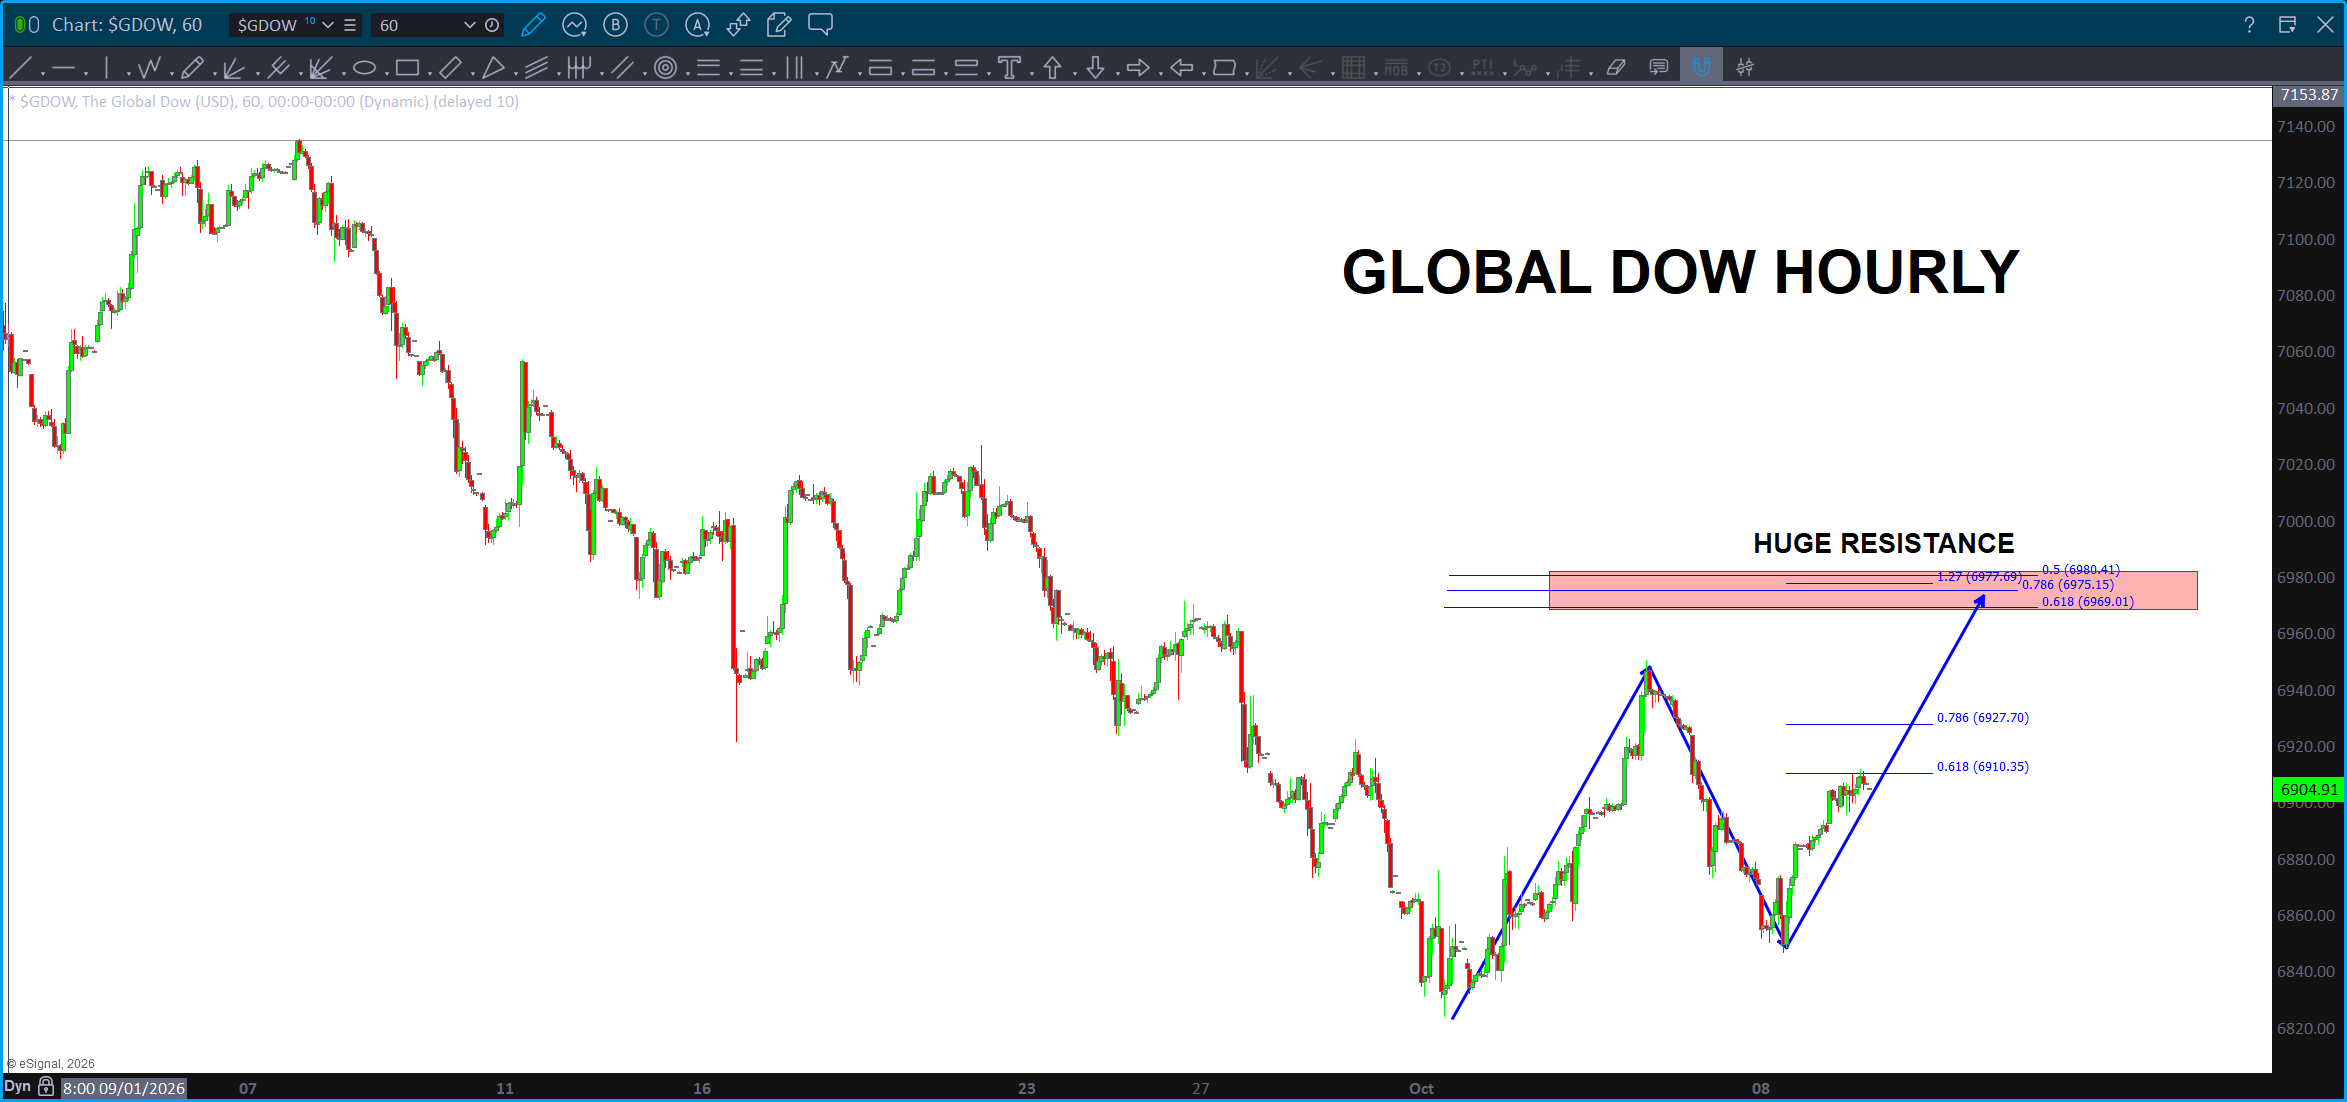
If you see the patterns then you’ll notice that we have a SELL set up occurring on the daily, so let’s step it down to an hourly:
Here’s the US Indices …
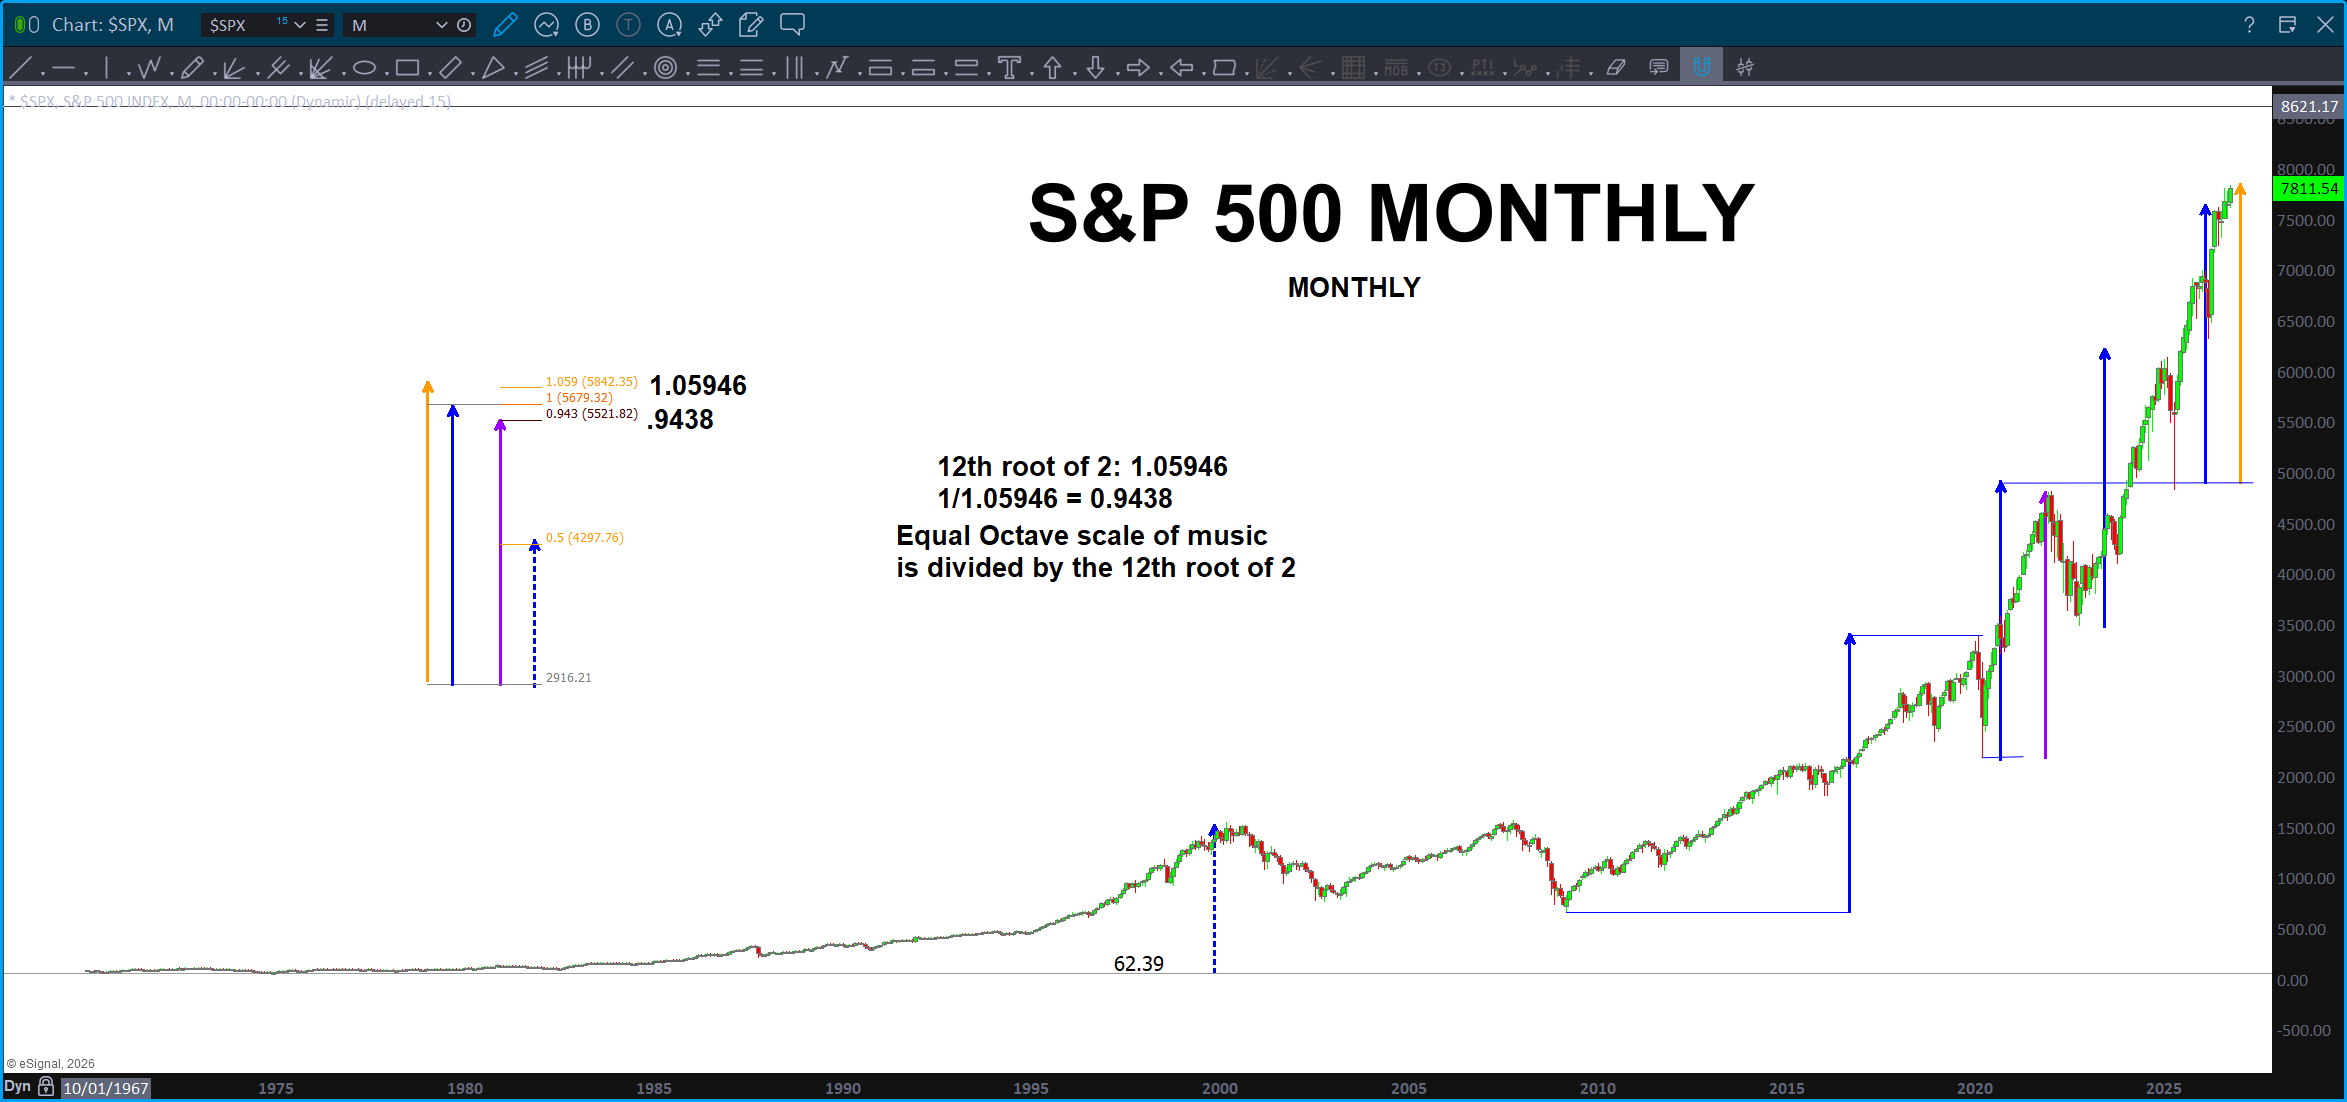
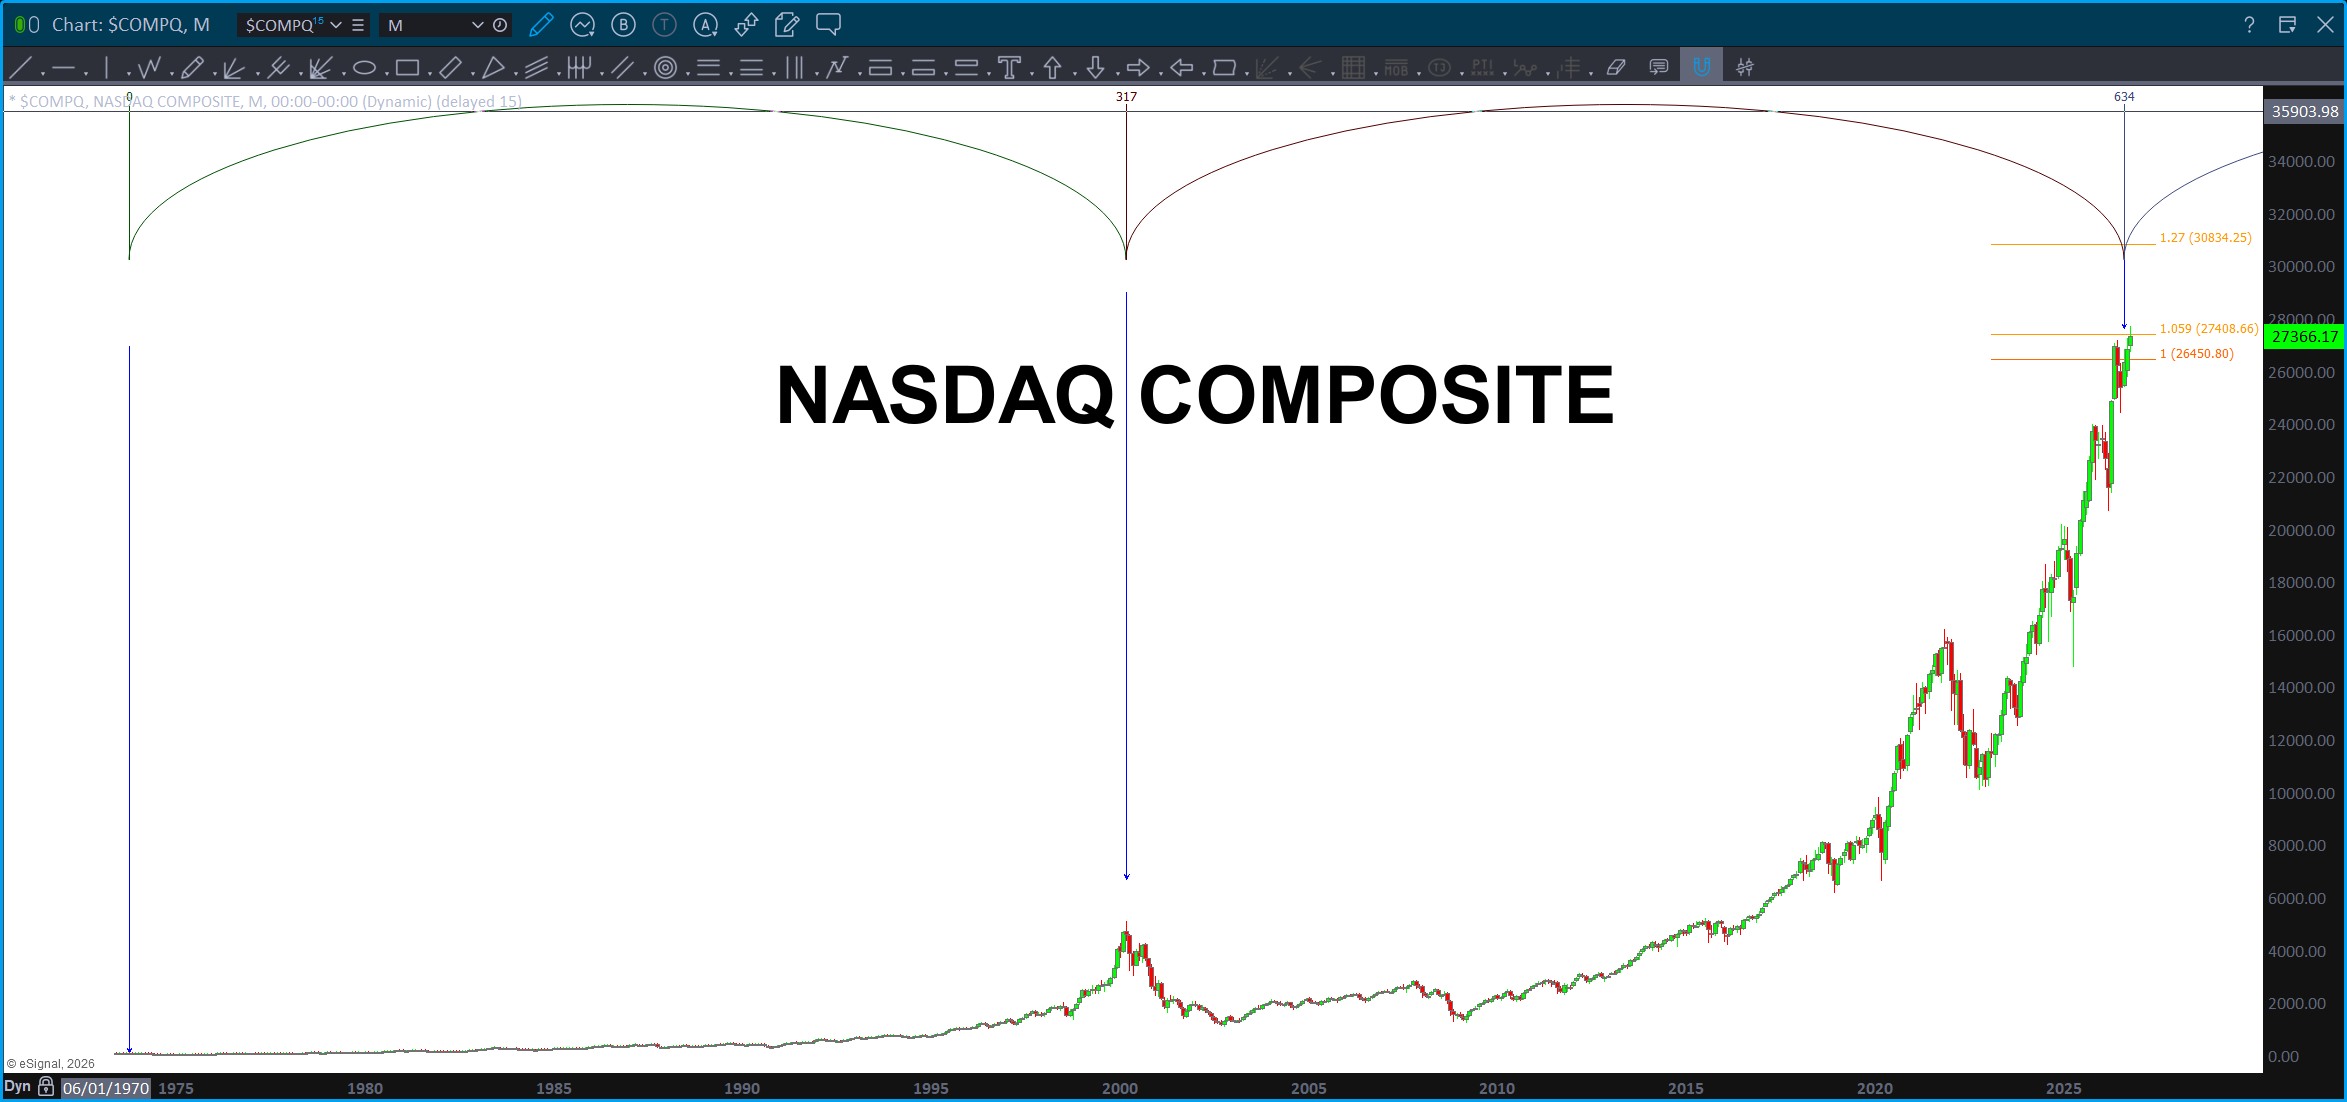
The ‘timing’ is off by one month w/ regard to the static cycle finder …
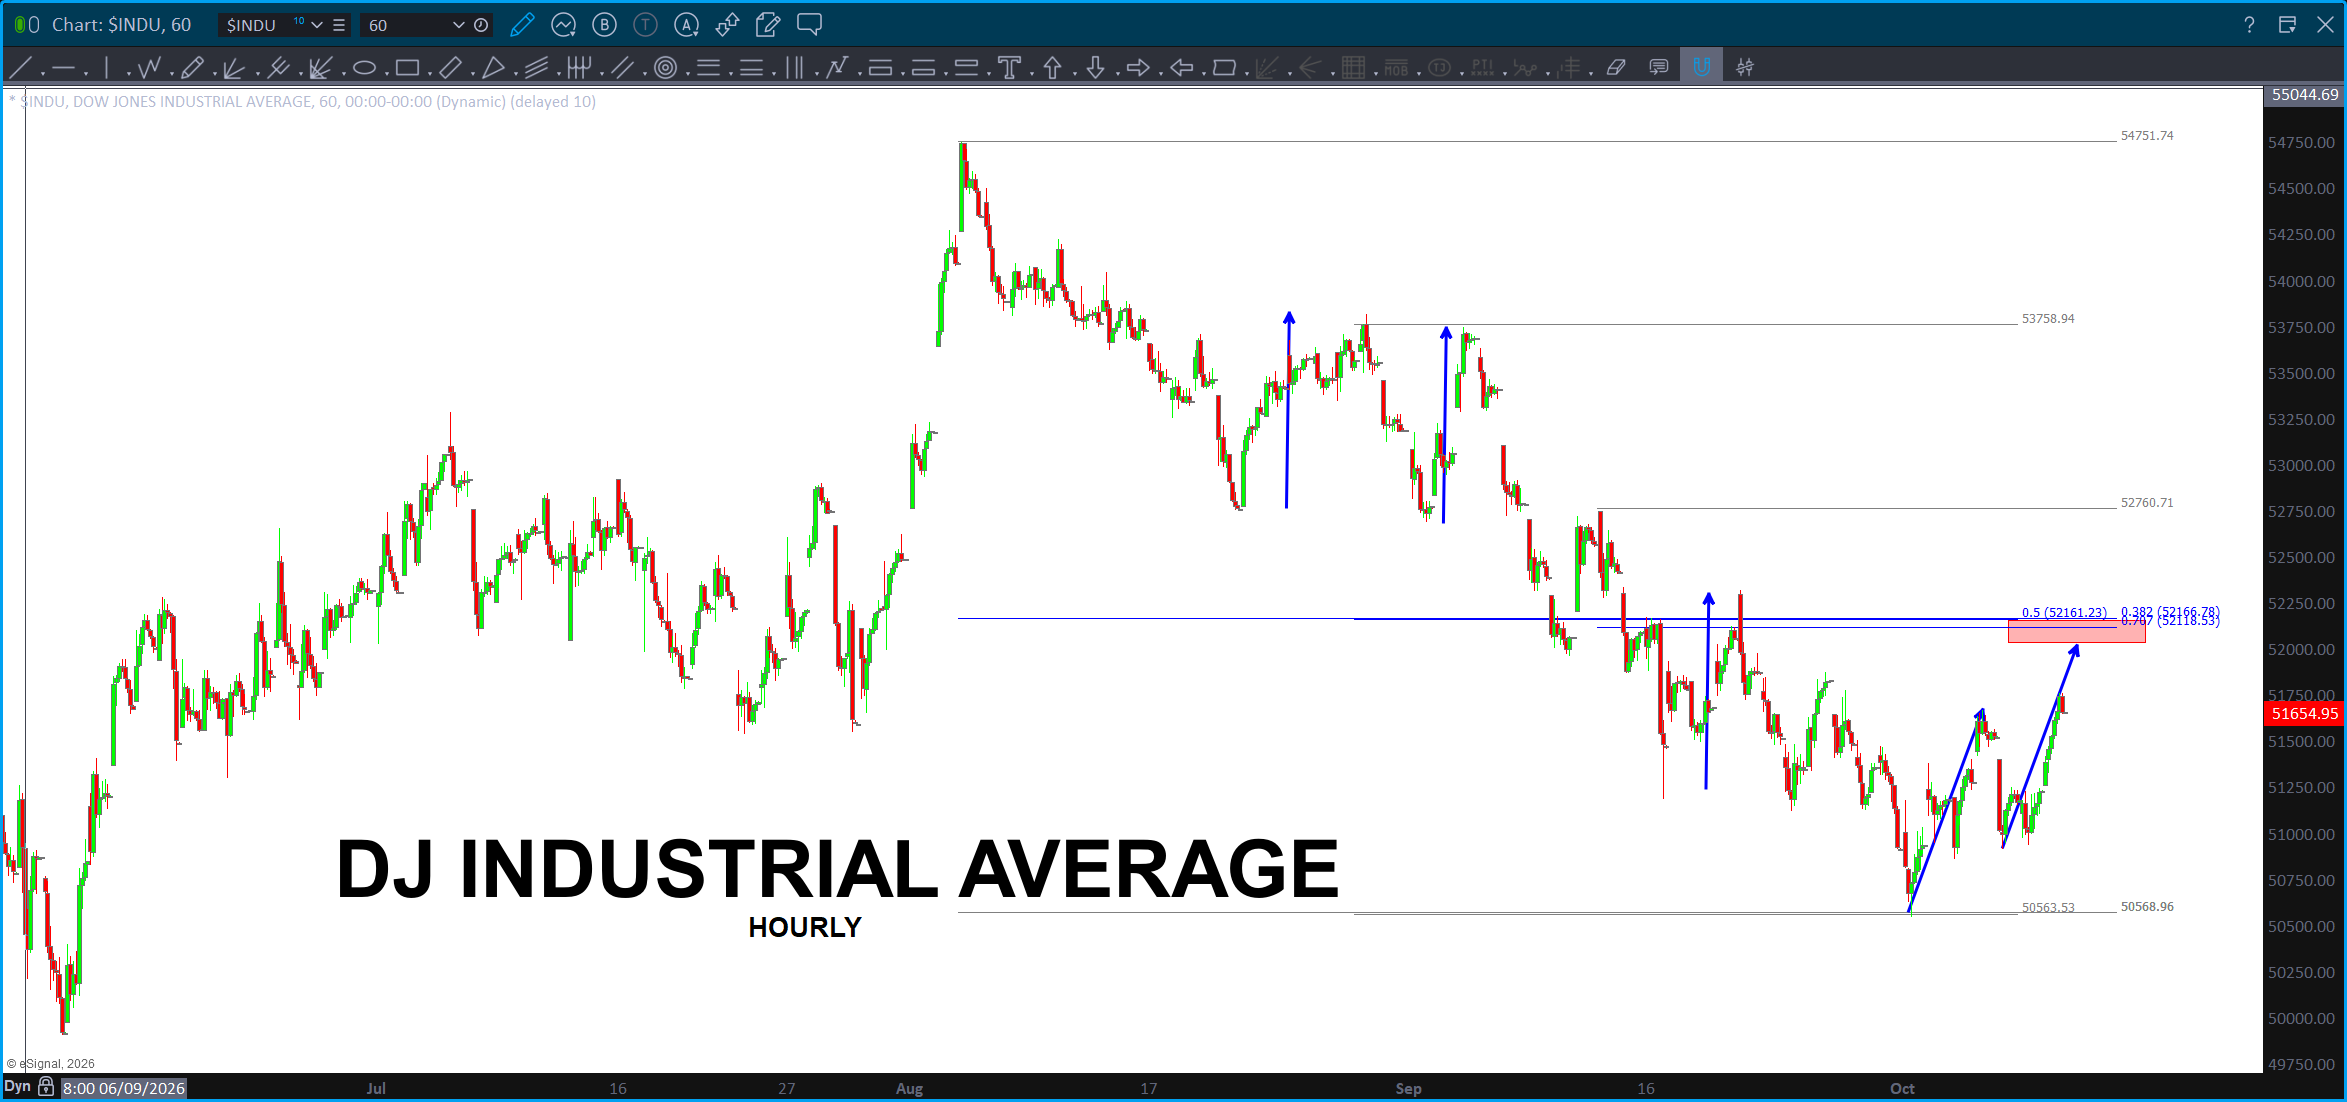
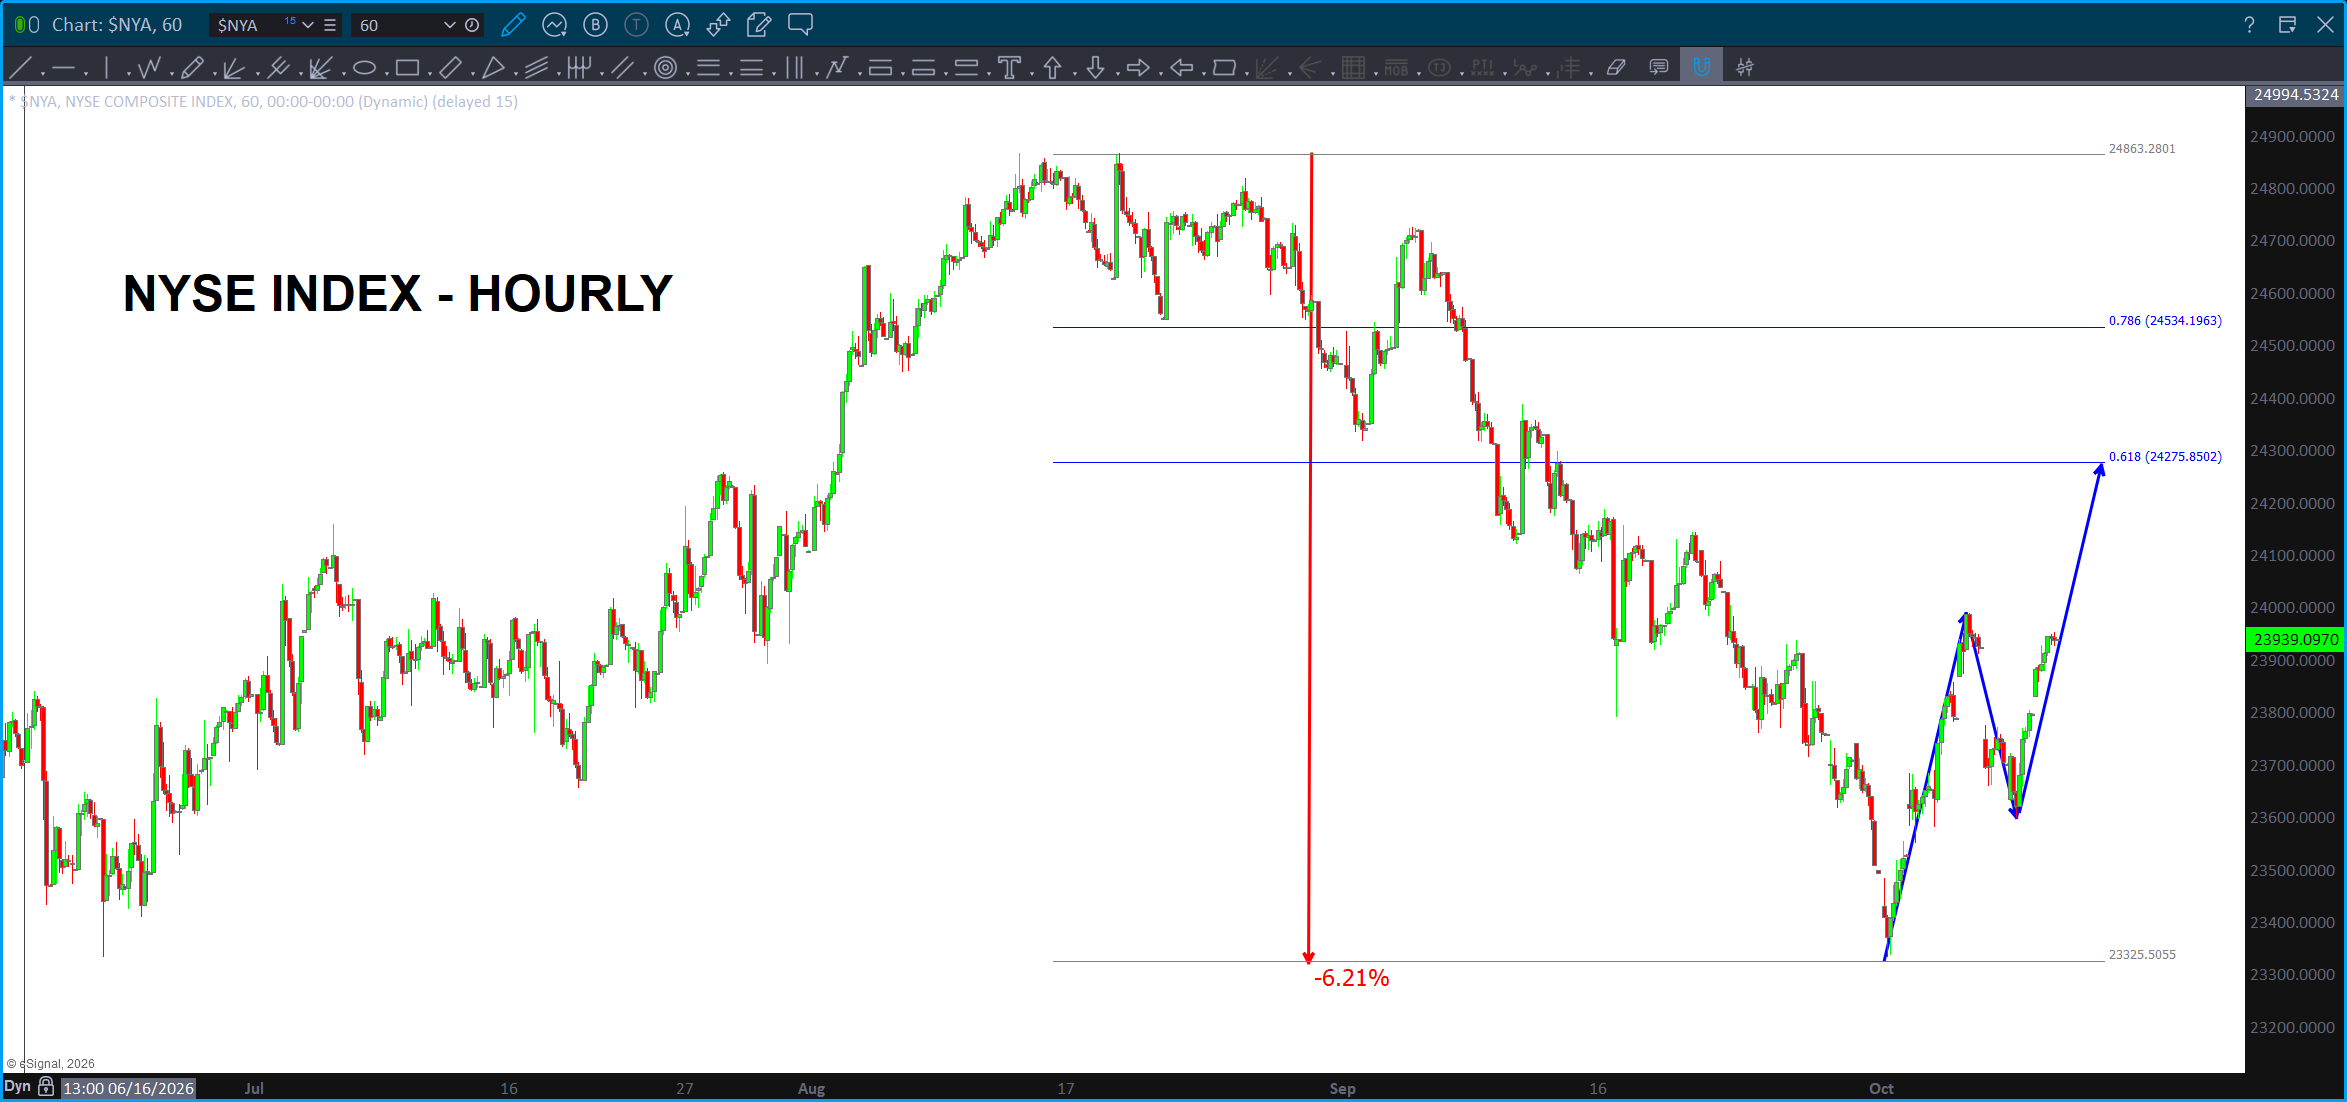
Finally, here’s the one that we should all take notice of:
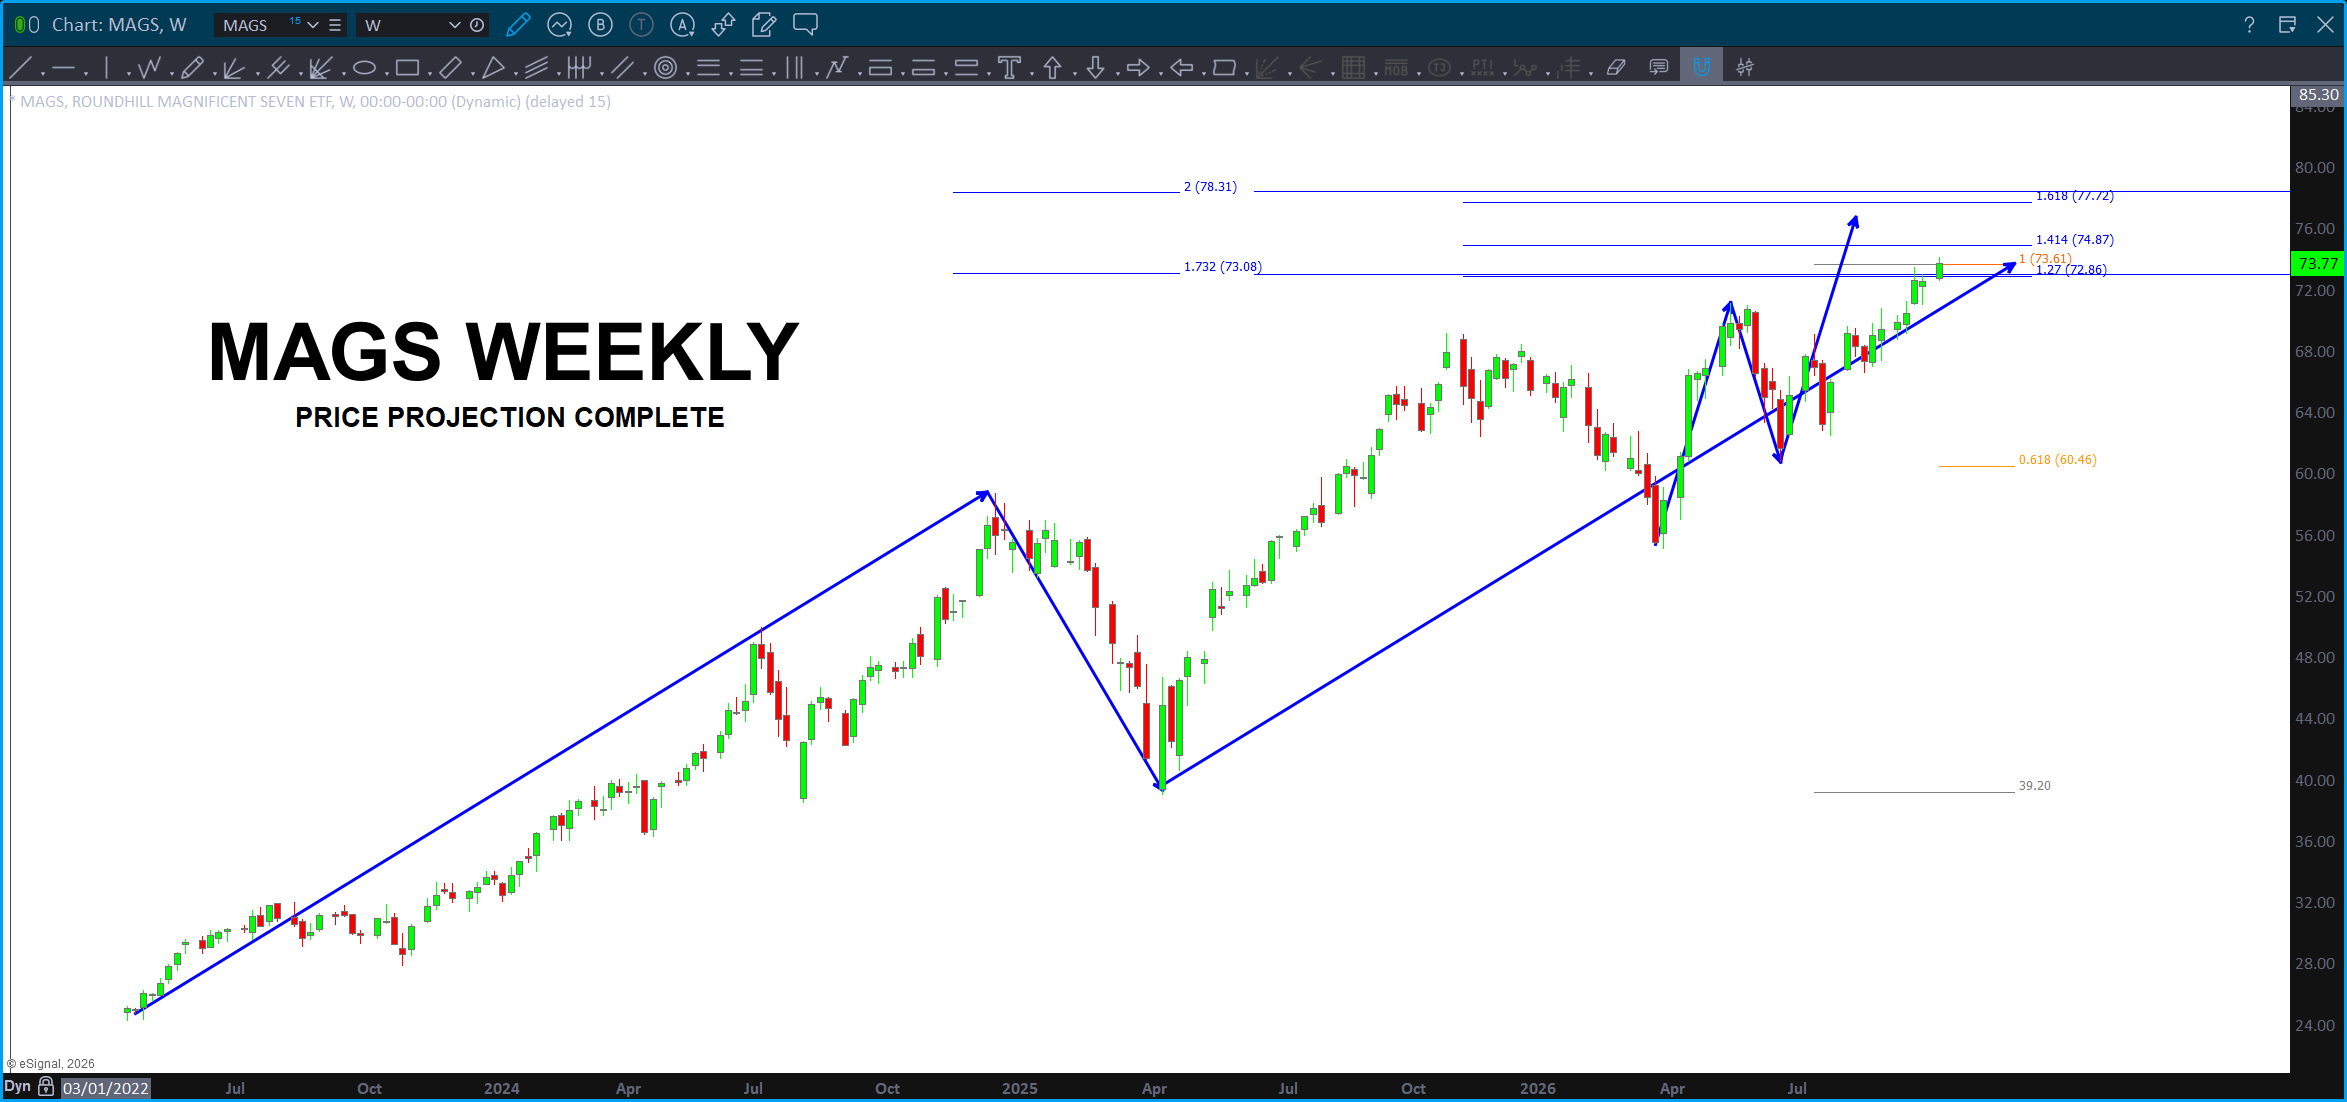
SELL PATTERN complete on the MAGS.
Bottom Line: we have a bear market confirmation w/ the DJ Industrials, Transports and Industrials .. Russell 2000 down, NYSE Index Down, BIG sell pattern on the semi-conductors. We are at resistance in the US equity complex.
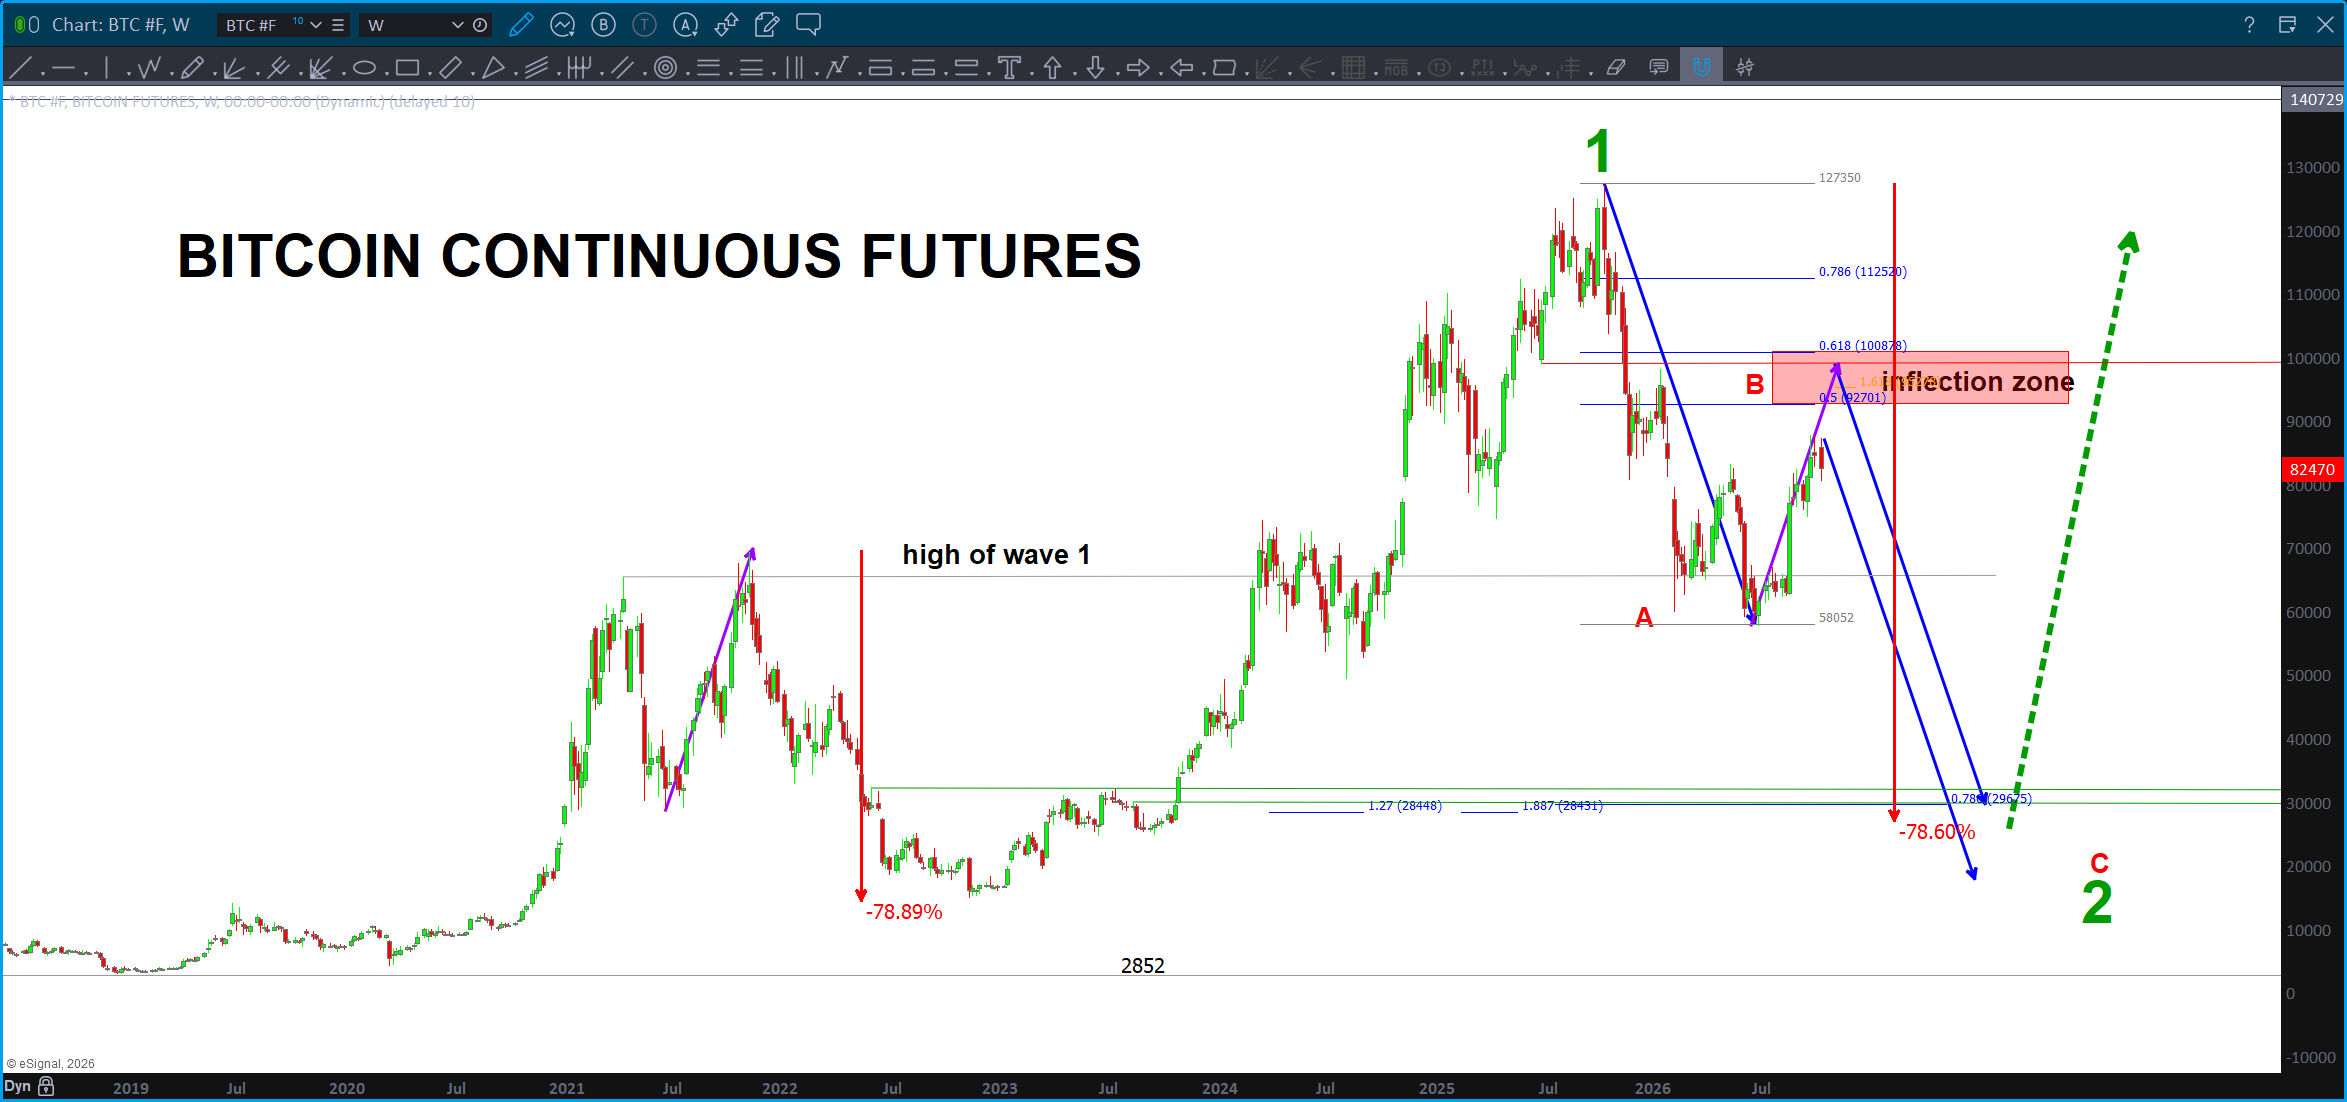
BITCOIN is tracking so nicely … can count 5 waves up so this could be the top for the next wave down else we go up into the red rectangle. Above that, analysis is wrong and will need to have another look.
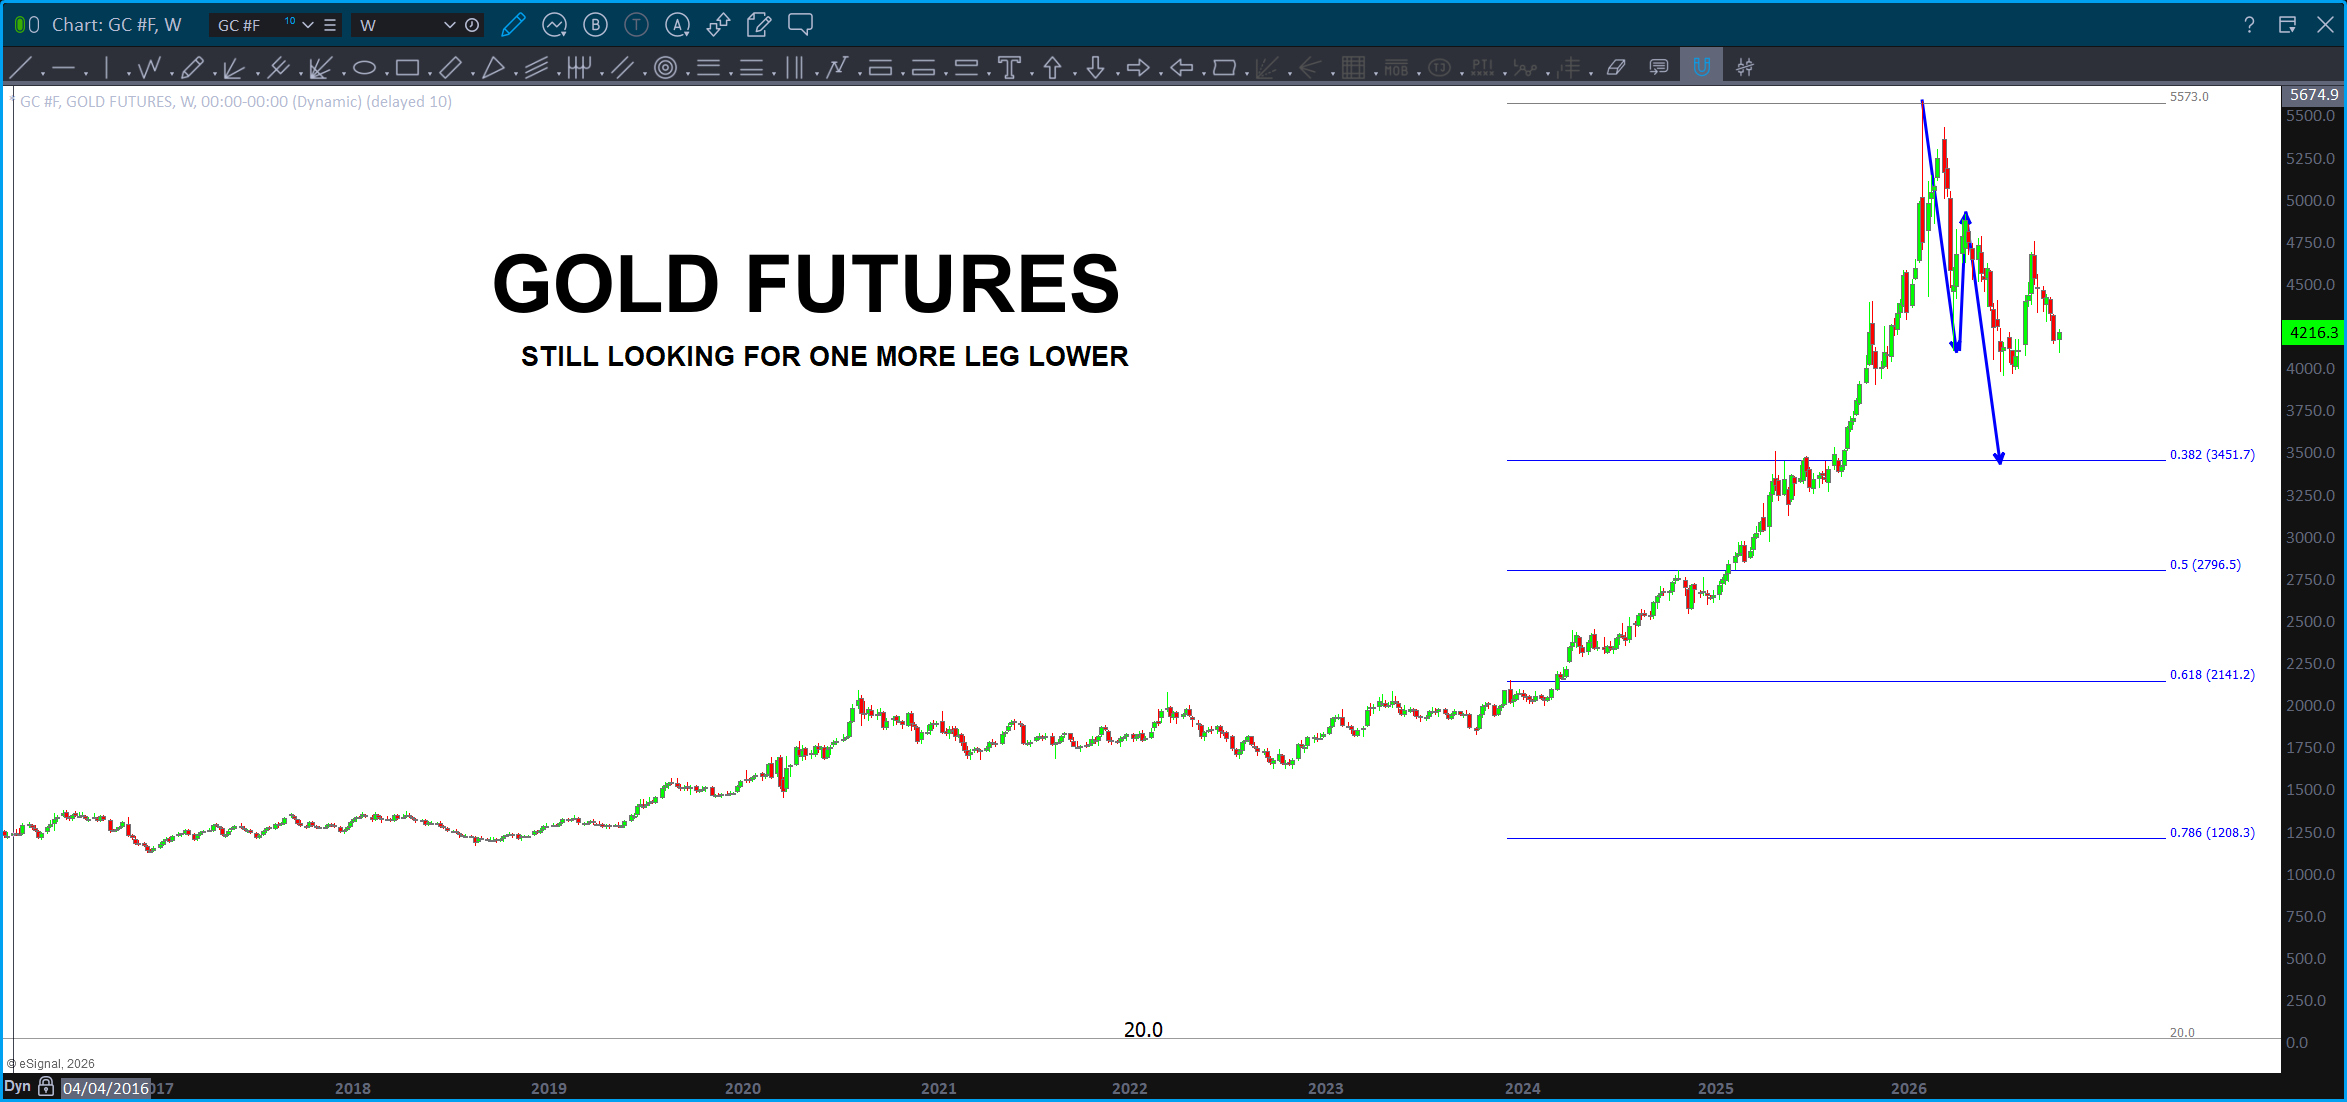
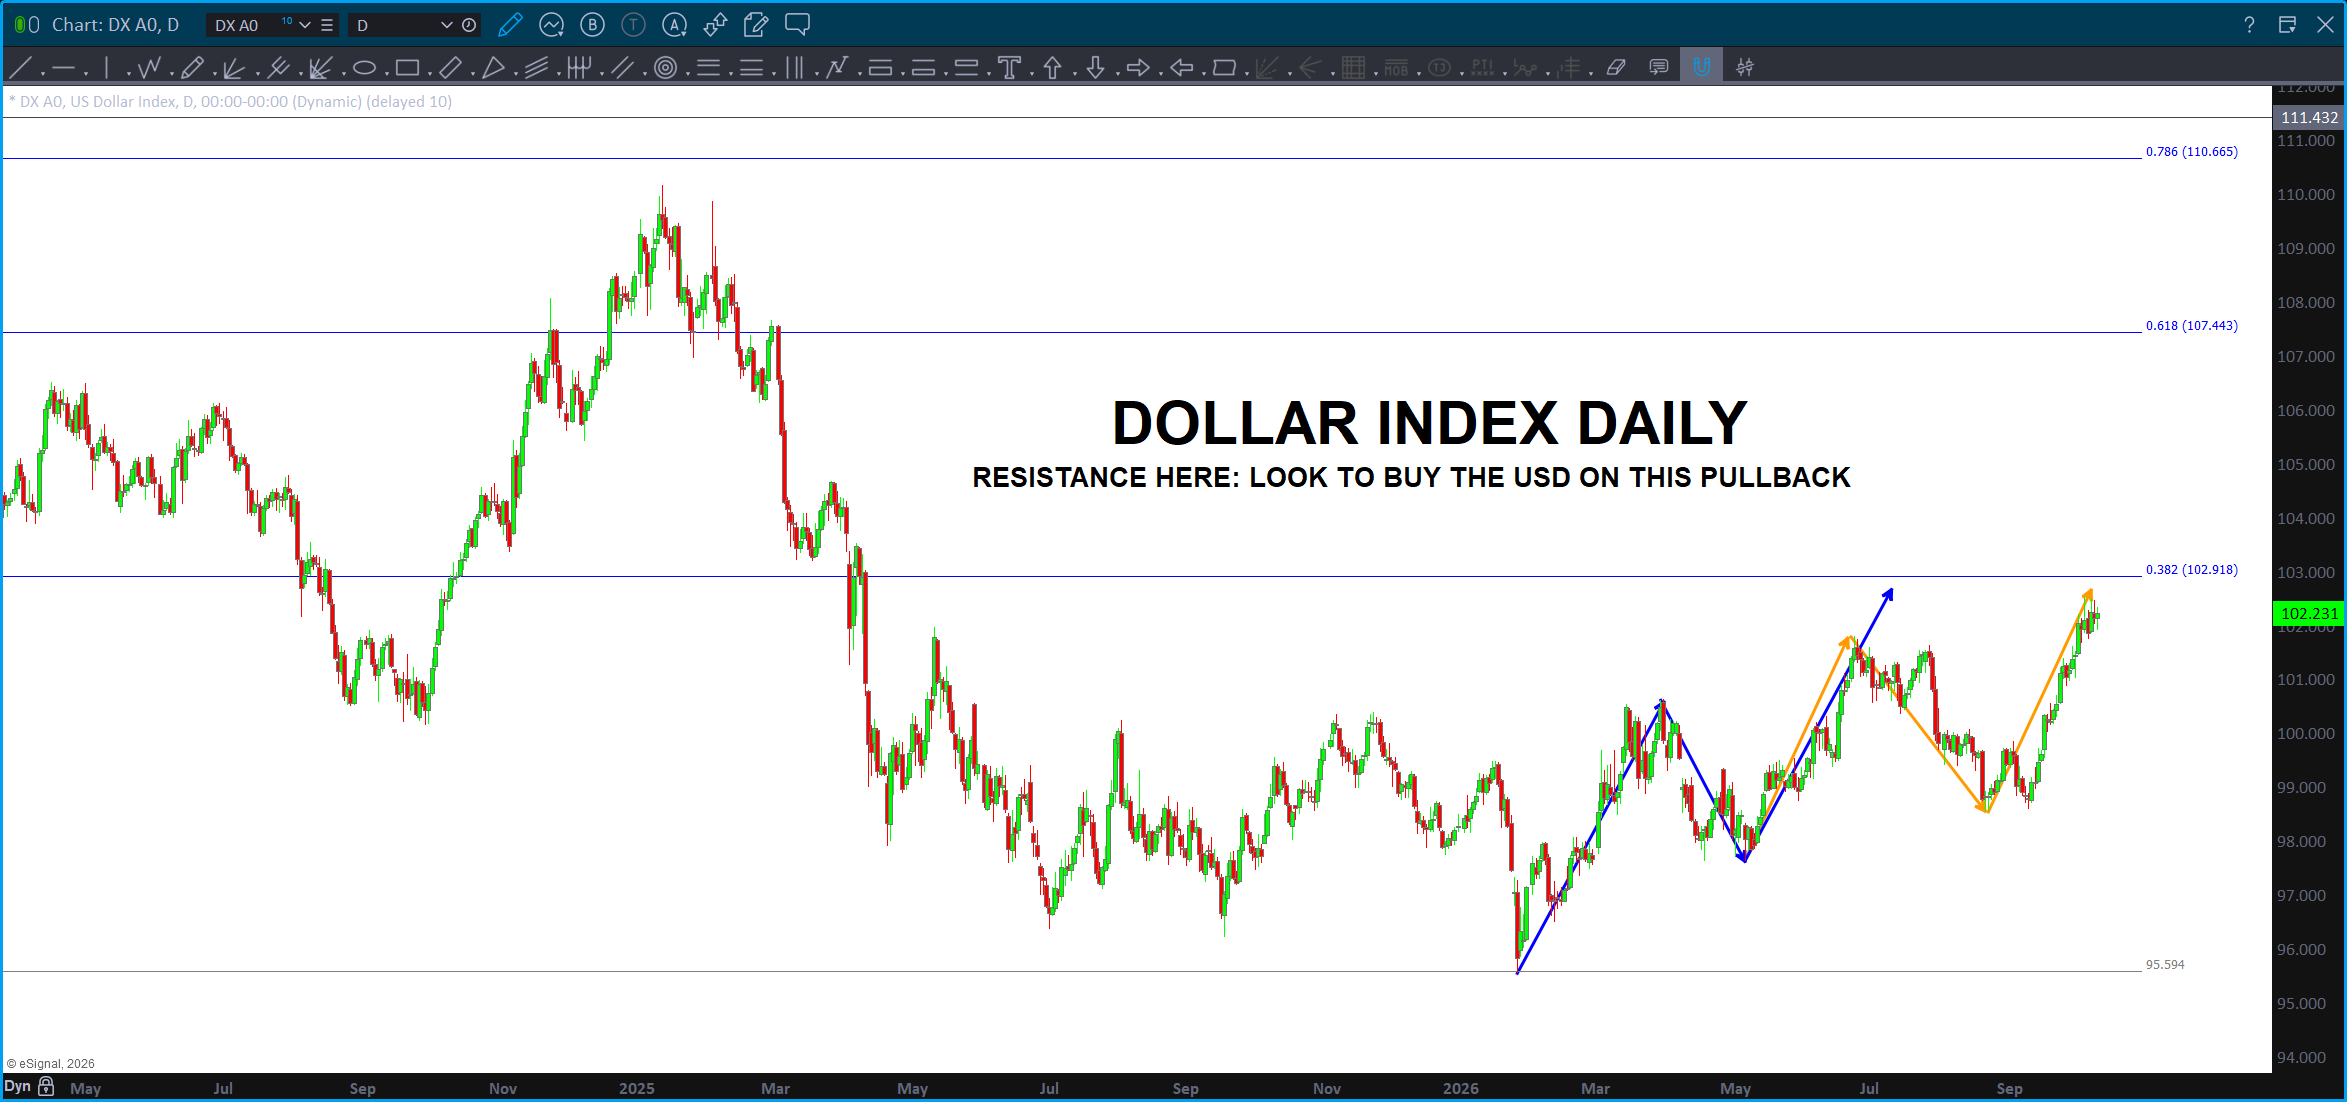
So, there’s a bunch of charts … bonds bounce, dollar resistance, gold/silver lower then BUY, equities resistance for a 3-4 weeks and just stand by … it’s going to be interesting!
Trust all are well.
Seriously.
Bart

