JCP a study of the Beauty and the Beast (?)

well that was “beastly” in the thumping that happened from 86 down to 5 … but it also happened in 2000 and look at the rally. What did JCP do? I have no idea and I don’t care …
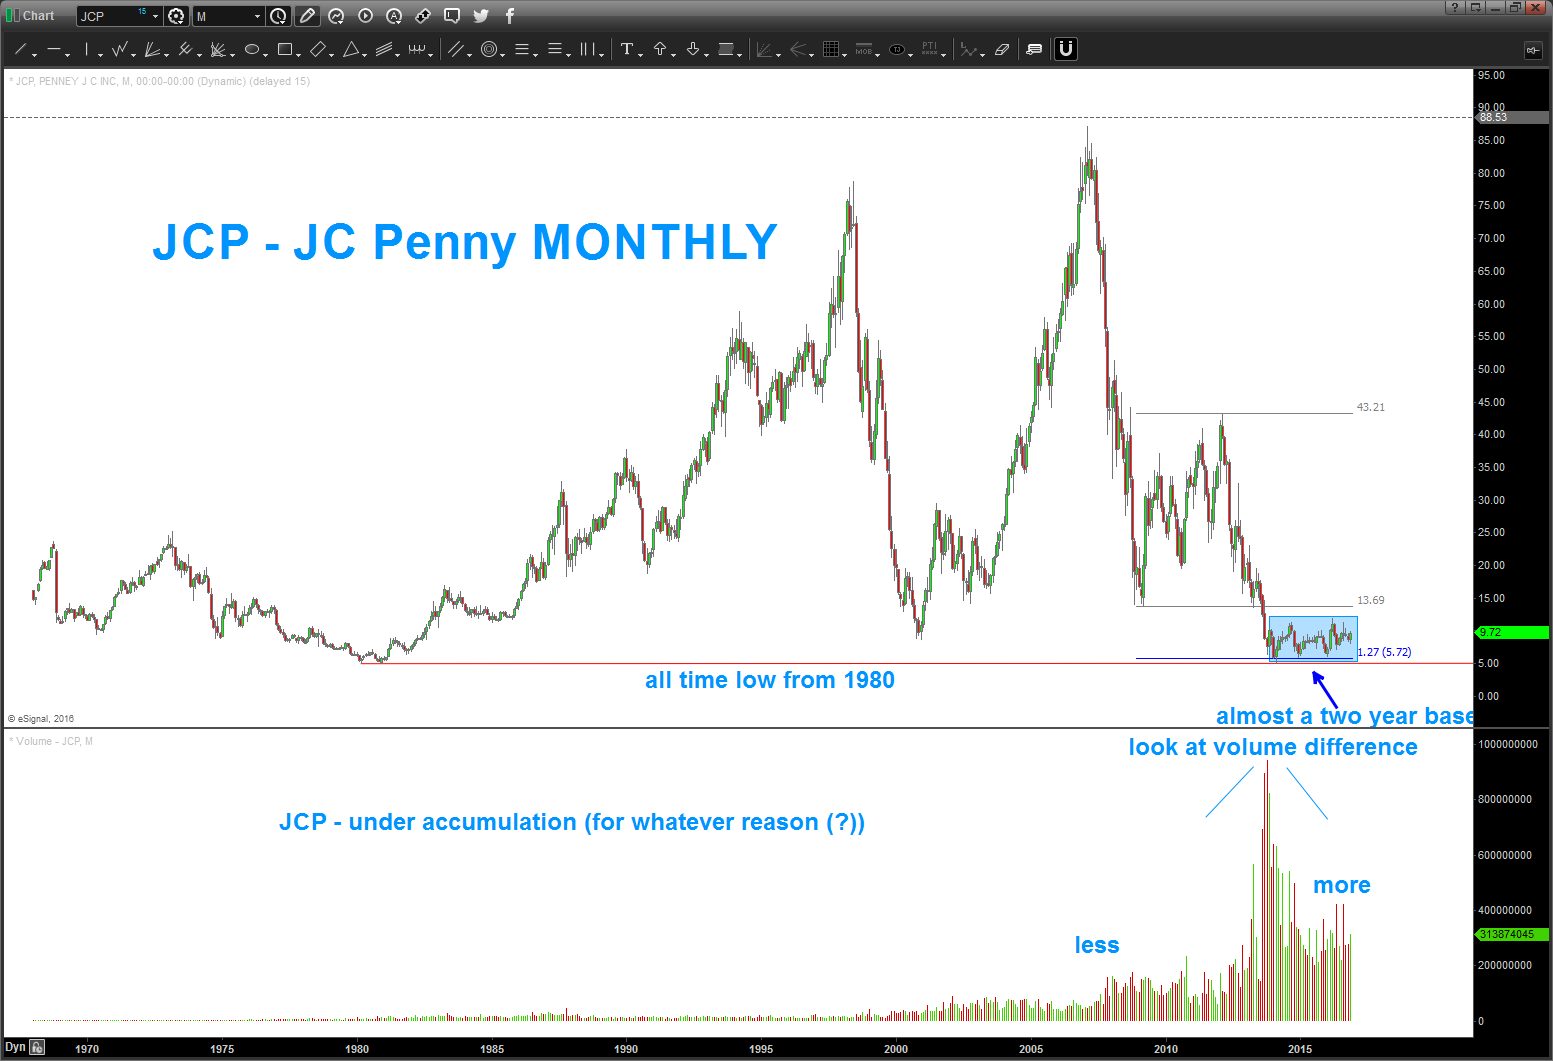
but the “beauty” is the POTENTIAL accumulation taking place …
- note the 1.27 extension that caught the all time low again from 1980
- note the almost two year base forming … IF it blows to the upside, this puppy could really run
- now look at the VOLUME. when the low as made .. the volume spike is what we like to call a ‘capitulation low’ and now look to the left and to the right of that high point in volume
- to the left, even as it was being sold sold sold volume was relatively light
- to the right, well the volume is much more pronounced … is it being accumulated for another run?
something to note … that’s all. a 1.27 PATTERN is present so I like that.
Now, the strategy is do you BUY a breakout – I never do as it has a 13.69 stiff polarity staring at it. but the return to the neckline or the breakout point is always a good strategy.
So, put this one on your radar .. again, I have NO IDEA how they are staying alive as a company. perhaps they have some crazy Amazon deal or digital store improvements or perhaps they are going to go bankrupt? If you remember I showed the pattern for ABX https://bartscharts.com/2015/07/19/barrick-gold-abx/ and that puppy ran into the mid 20’s. Additionally, showed the sell for the Banking Index and that got smoked.
I HAVE NO IDEA WHICH ONES WILL WORK just looking for patterns and things that NOBODY else is looking at.
What I can tell you is i LOVE LONG BASES that resolve to the upside … one to watch folks.
Bart

JCP – gave up the ghost today on bigger loss than expected – any possible chart pattern or harmonic that saves this ?