Technician’s Toolbox: Measured Moves …
Measured moves are 1) the easiest and 2) one of the most important techniques in the technicians toolbox.
They represent the “sum” of buyers and sellers and – on long term charts – extremely accurate at marking inflections points and risk controlled entry points. Let’s face it, besides the retail portion (me and you) are going to enter and exit all the time. But the big institutional money, they move the market. And, they leave footprints … measured moves.
I don’t like to go back in time and the do the “could of would of should of” but I just want to show some charts w/ measured moves …
Take a peak at the KIWI vs USD:
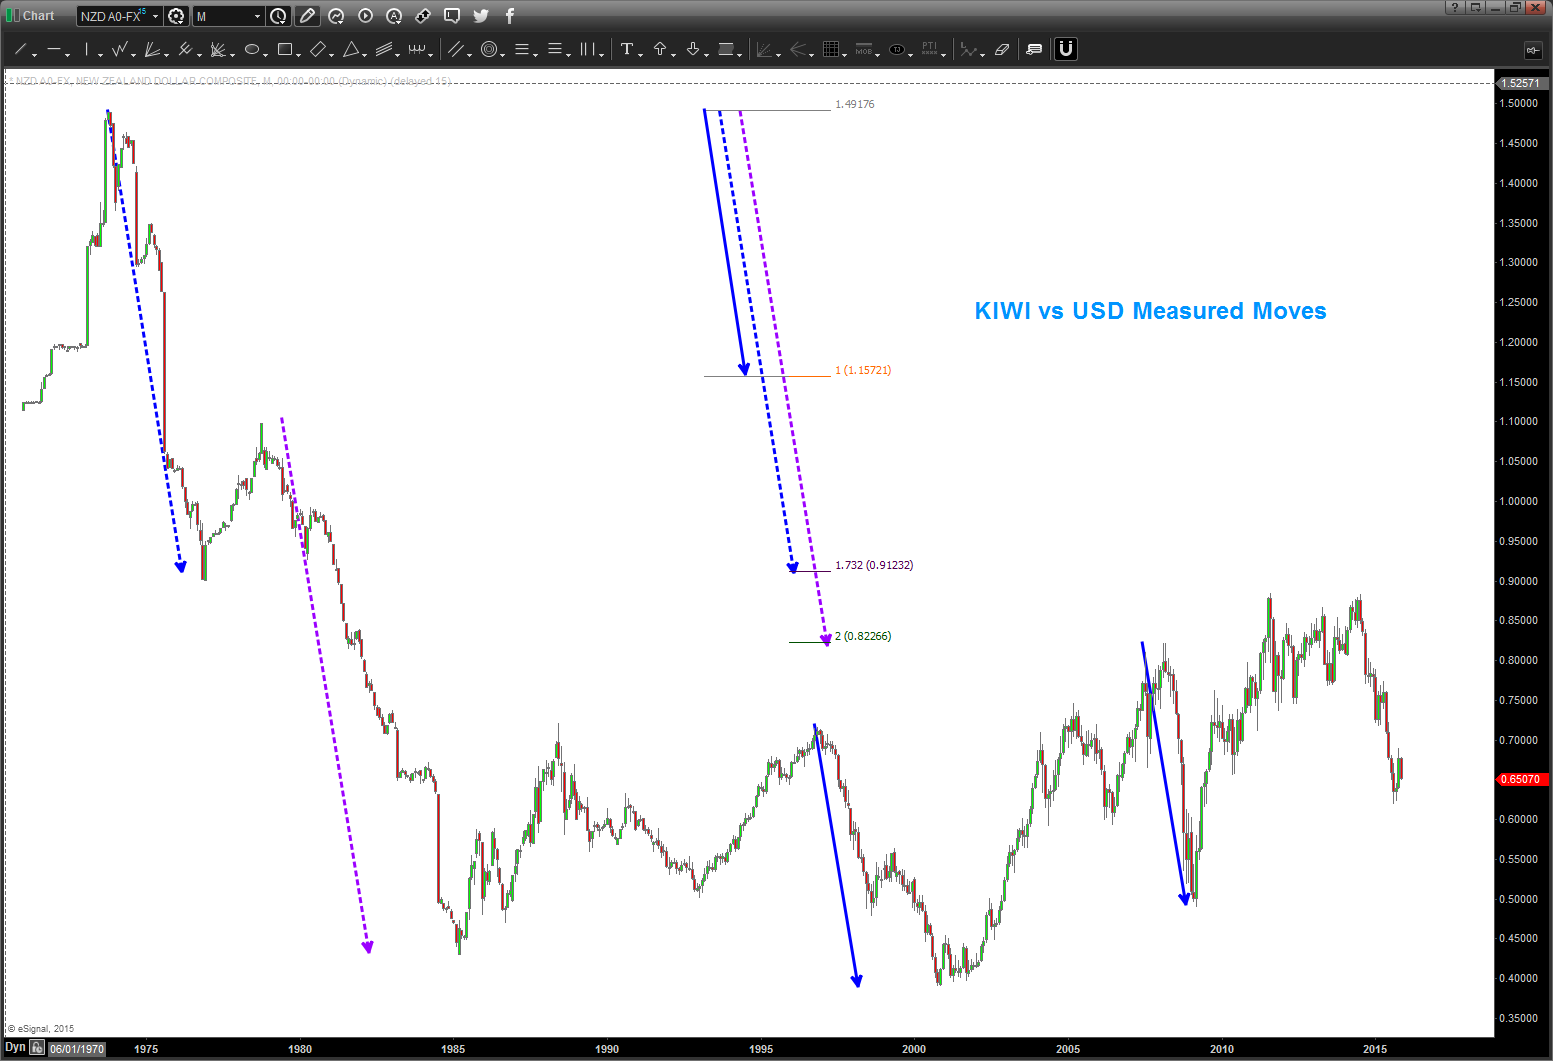
if you note the blue arrow you’ll see that this stopped the market EXACTLY in 2009 … there was no retracement (typical that is) or anything like that … go to the longest charts possible and you’ll find these measured moves. USE THEM … also note, the blue arrow has harmonic components to the crash from 1972-1985. 1.732 (square root of 3) and 2x blue arrow nailed the measured moves down … almost perfectly.
here’s one more – the dollar index. (hint hint, check this one out)
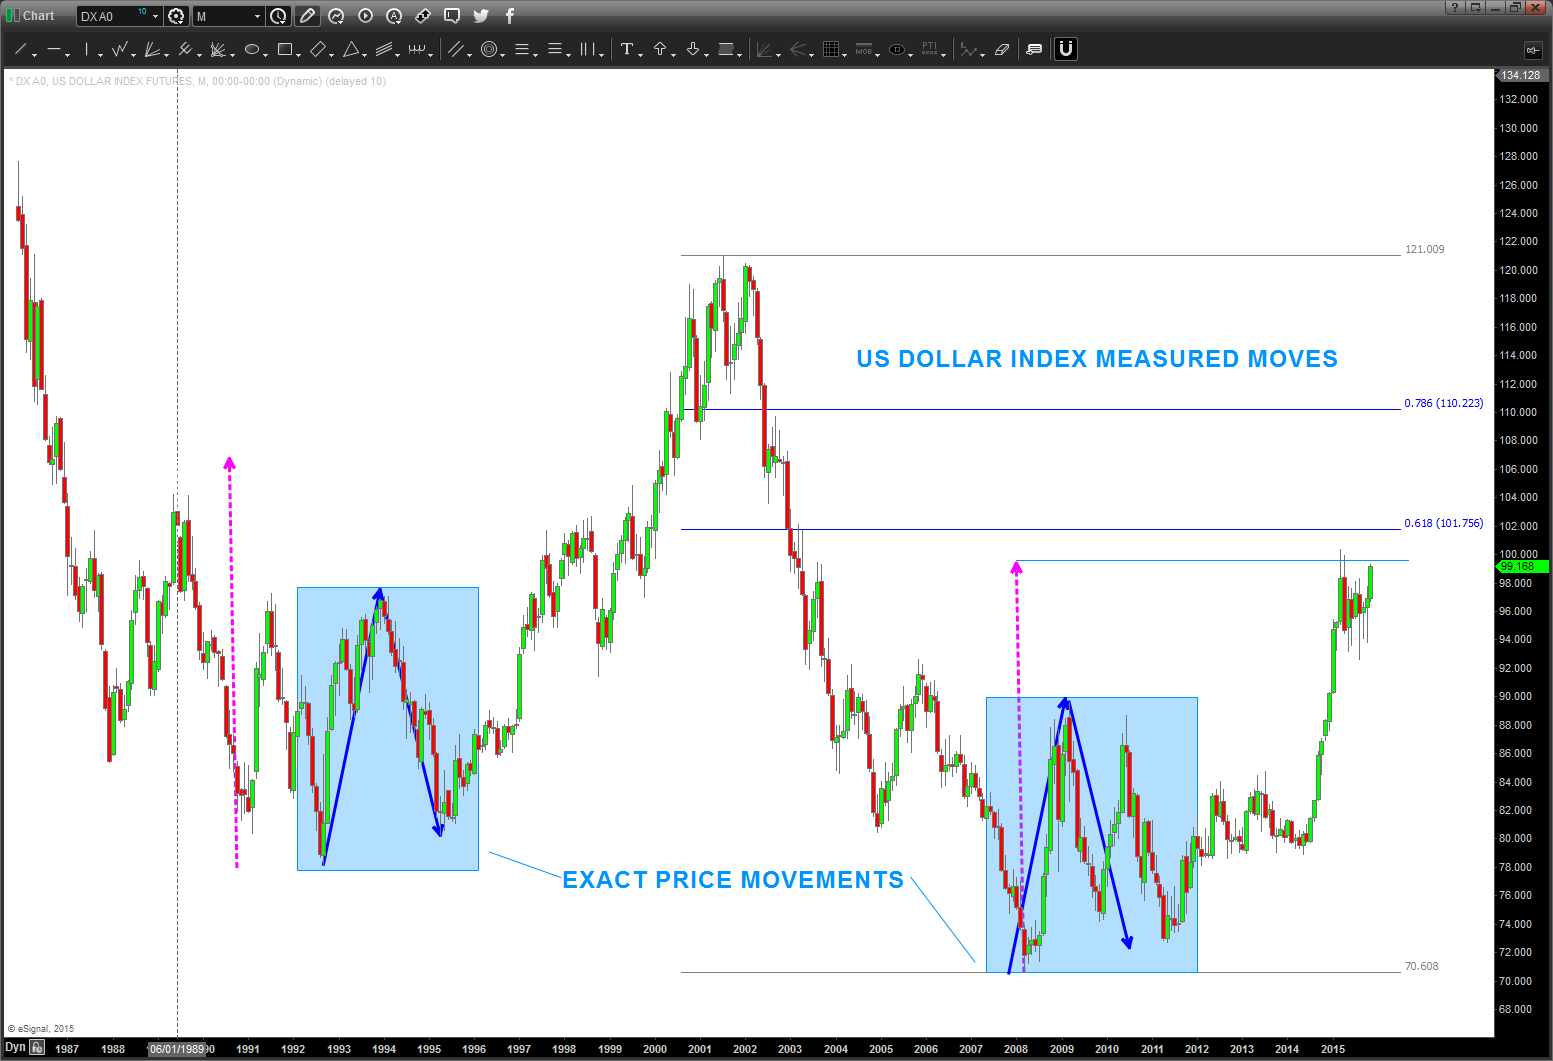
EVERY MOVE SINCE THE 2008 LOW HAS BEEN A MEASURED MOVE REPLICA ….
so, hopefully I have your attention. do yourself a favor, before you put on indicator chaos (I used to also) clear the chart of all indicators and just look at price and time. find these key measured moves and either jot them down or annotate them on your chart and THEN put the indicators that you use back on the chart. you’ll be glad you did ….
that brings us to the Australian Dollar.
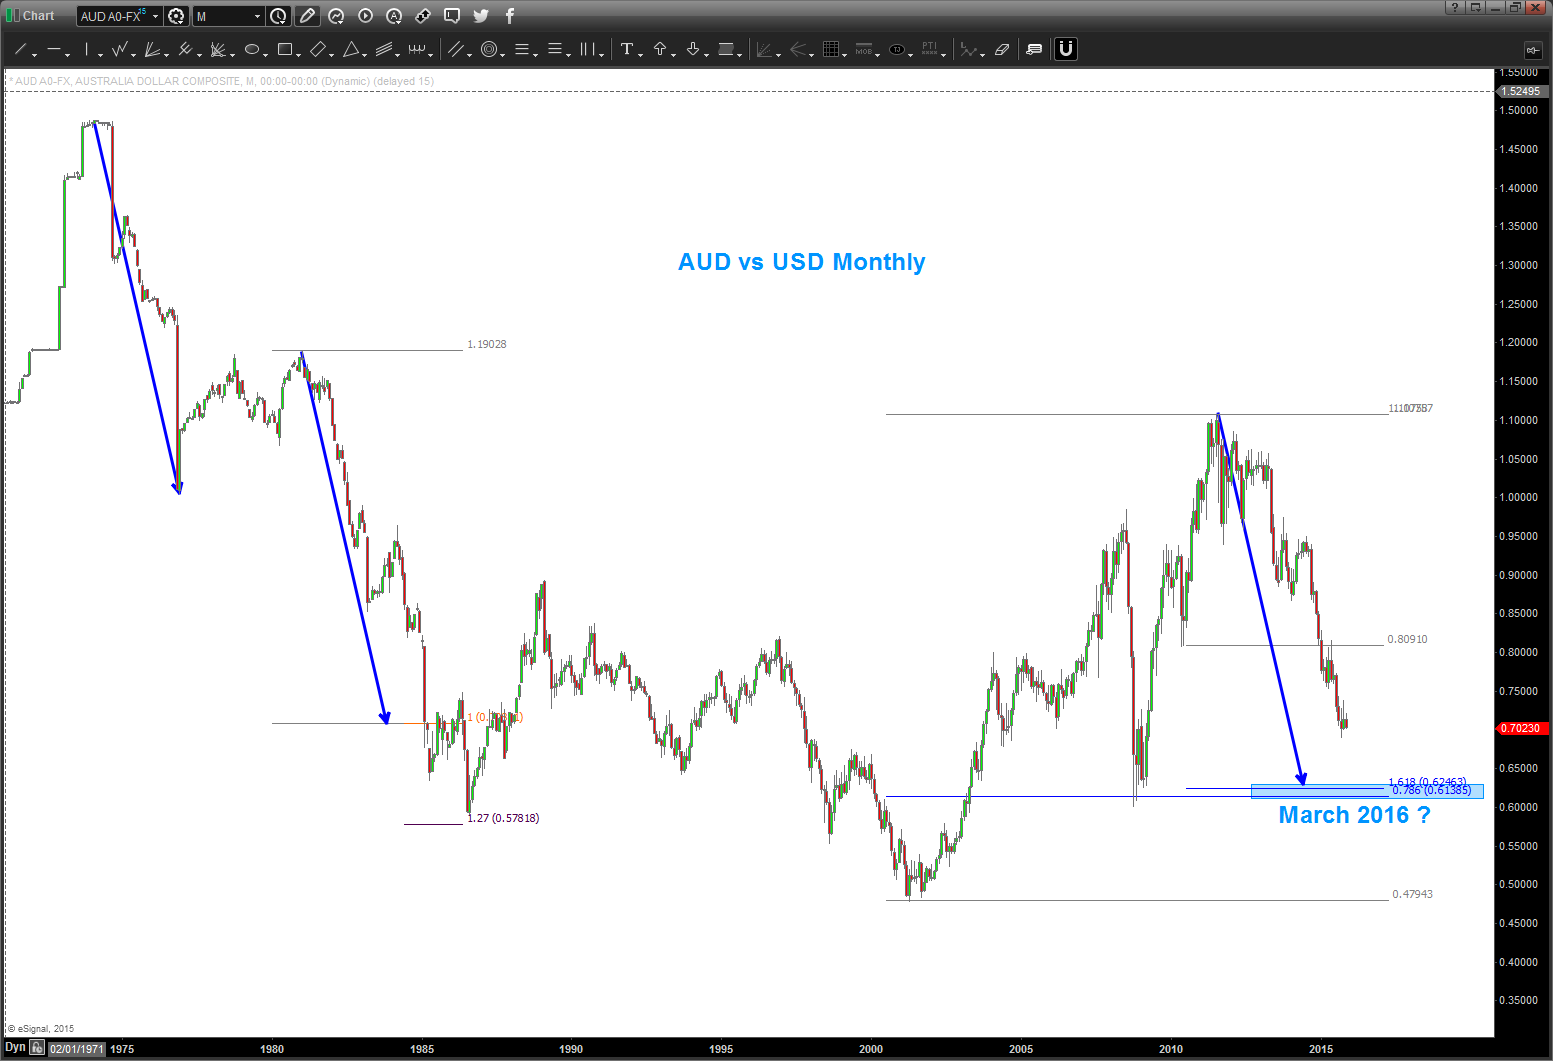
Usually, when you have a measured move lying on a FIB and Square of Nine target it’s awesome. Not such thing for the Aussie and if you’ve been following my blog you’ll see I was looking to LONG AUD vs USD. Why? Here’s the chart:
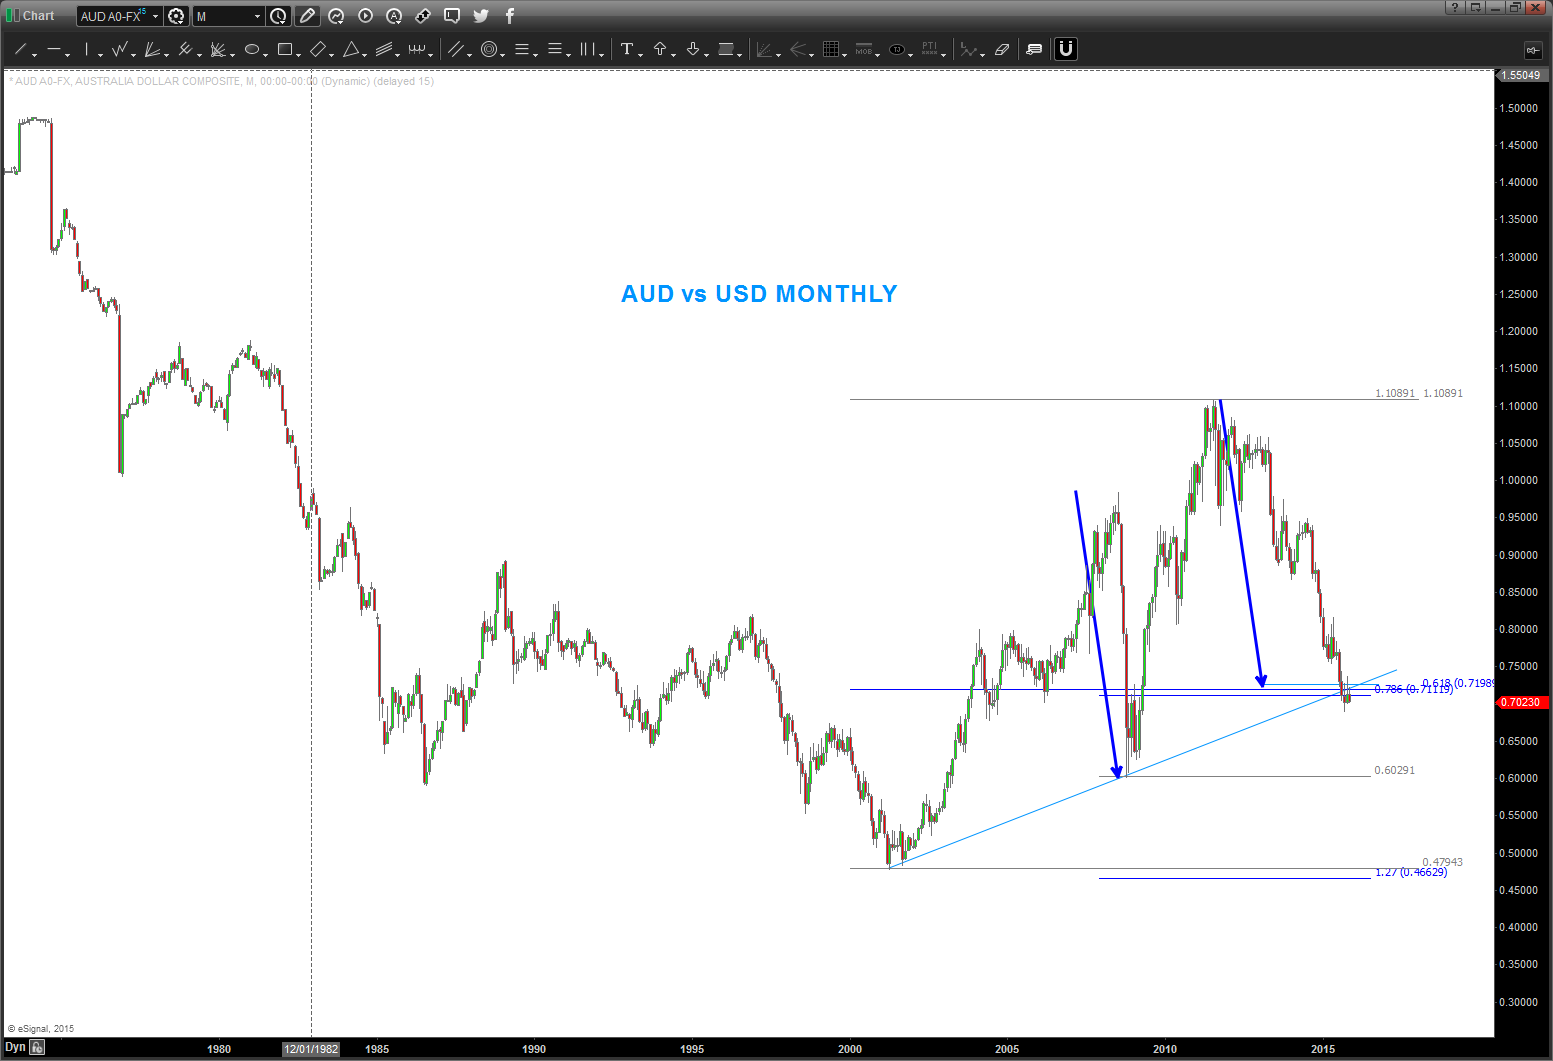
We had a .618/.786 overlap w/ in 50+ pips, a very powerful measured move (blue arrow) and a low to high trend line all coming in … the darn thing hasn’t budged and, in fact, it’s closed for 3 months below the .618 retracement from the all time low. W E A K … no pattern to BUY ever appeared but a sell pattern did and I missed it .. I was too bias about trying to get long. Ugh. Anyway, when something like this doesn’t cause a BIG MOVE then the market is fundamentally really weak. So what should we do? Well, break out the measured moves and doing some basic time work …
Here’s the time work .. note it looks like we have a cycle low coming in March 2016:
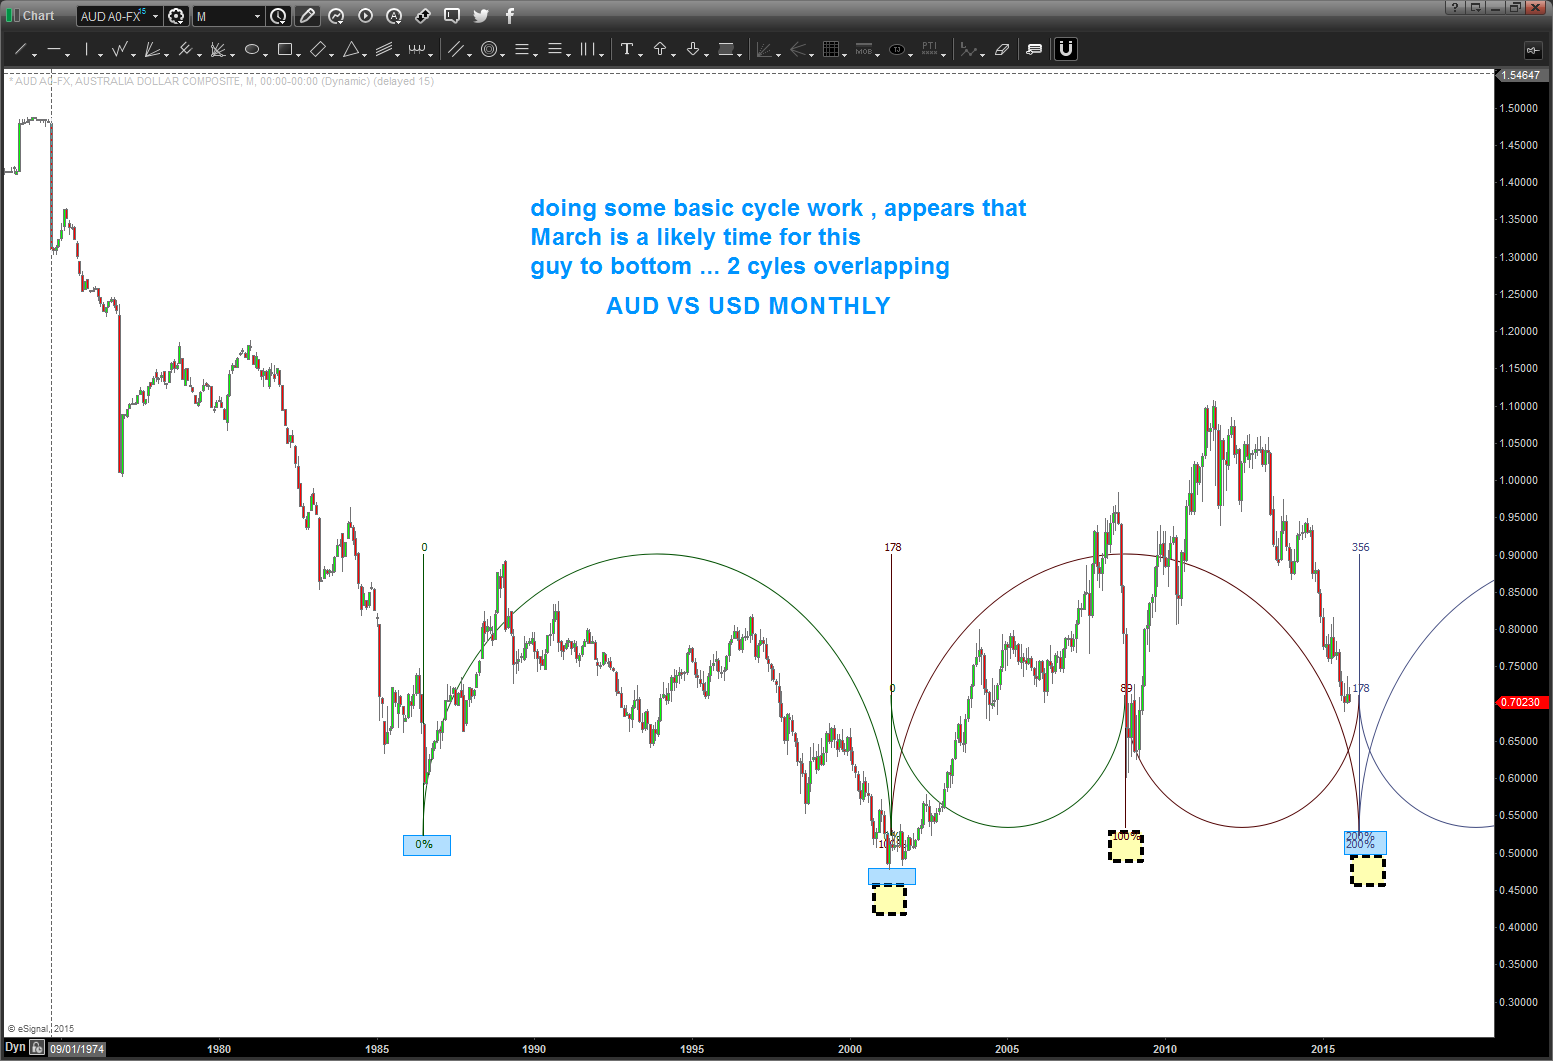
what’s could the price be? Well, I think it’s going to be a measured move …
so, back to the drawing board .. this one is going to be interesting. Also, note what this means for oil, natural gas, gasoline futures, etc.
Bart
