Get ready to rumble ..
look at this set-up ….
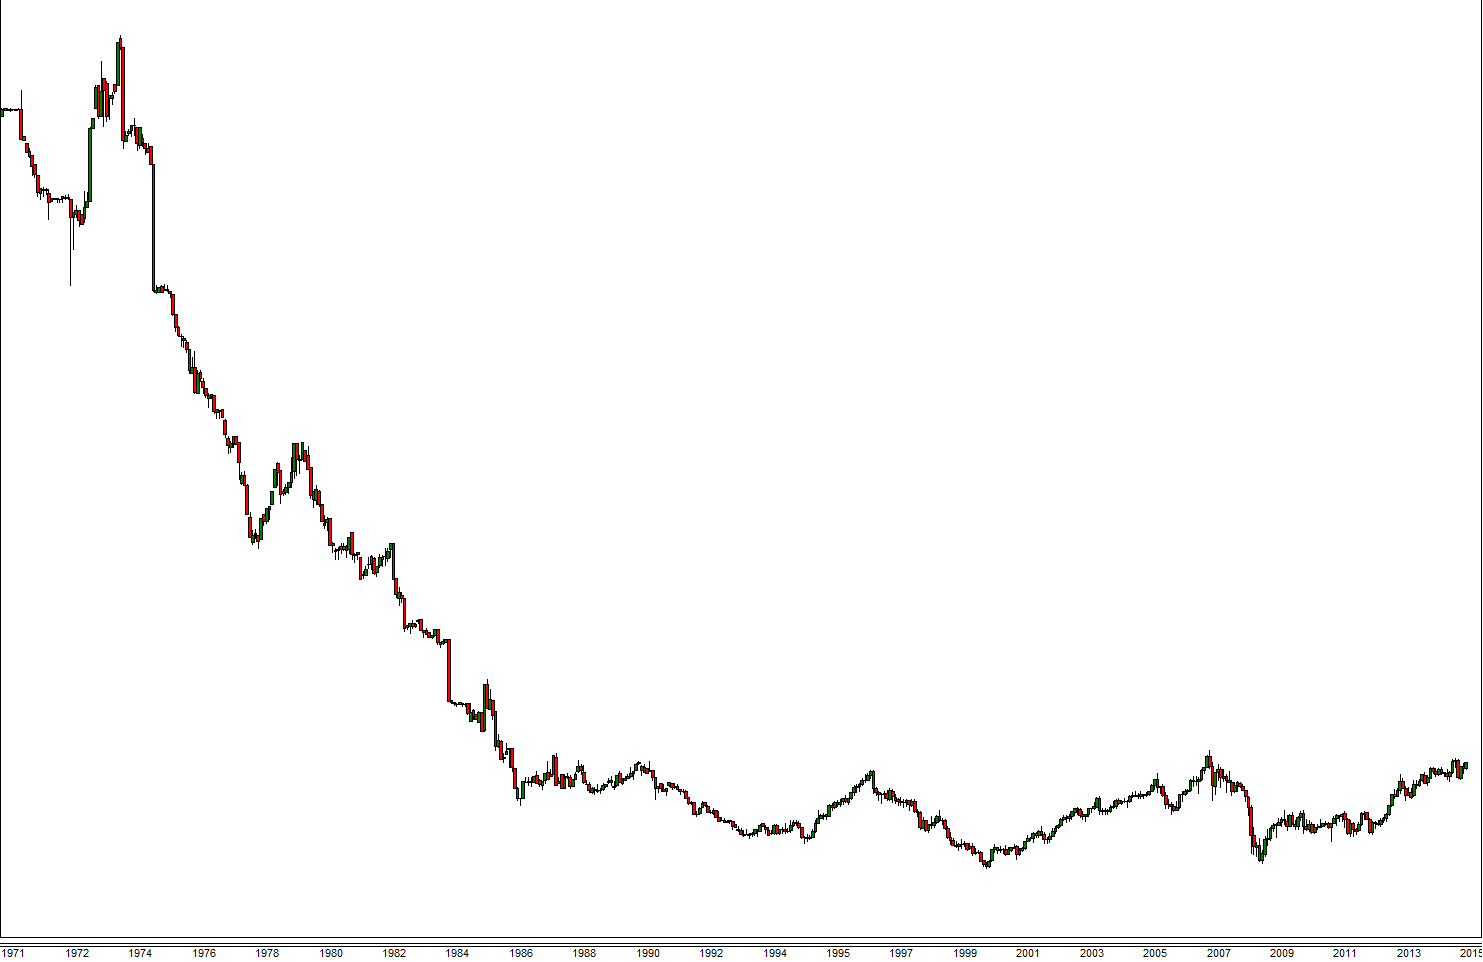
you can tell this is a currency chart by the 1971-1972 period (when “they” started floating exchange rates.
from the high in 1973-1974 this puppy went straight down into 1986 and then built a base of, roughly, 30 years.
when and IF this base blows to the upside – game on.
will update, in the coming days, the currency pair and strategies to employ …
make it a great day.
Bart