


Shown this one a couple times … certainly looks like we are getting or at the VERY crucial resistance level on the KBW.
Same picture, sort of, w/ the XLF:

Folks, I’ve been blogging about the banks/financials – they lead us up and lead us down. Until “they” crack this fragile march up the wall of worry can continue. That being said, these charts are showing the measured moves associated corrections in the past are appearing, now.
The two charts above also exhibit a clear 5 waves … hmmmm.
Well, how about JPM?

Note, this is a Monthly, since IPO, chart of JPM. Also note, it’s LOG scale so we are dealing w/ percentages .. you can always tell by looking at the right (or left) price margin. When it’s normal spacing you are using normal scaling but when you see big jumps like above – that’s LOG scaling. Well, guess what? ABCD on LOG scale works also! So … couple converging trendlines w/ a projection pattern complete. Note, remember the above about the KBW/XLF.
Well, what else is in the news folks? Silver …yes, I’ve been tracking silver and nailed the LOW in silver (folks, it was just the same correction as the last one ..) at 11 and said ‘it will go to new highs.’
Well, now is the true confessions time … I’ve been doing some fundamental reading (woah, what?) about Silver simply because it’s a weapons system w/in the already started cognitive 5D global war which is raging around us. If you don’t think that, well, “that’s your opinion … (pause) ….man” The Dude . There is SO MUCH GOING ON RIGHT NOW FOLKS ON MANY DIMENSIONS that its hard to keep up. We are living in the most AMAZING TIMES. Period. Dot. So, the reading has helped me understand some of the moves occurring right now … but this euphoria? Well, another confession time, I went to the long term futures chart below many times and ‘in my mind’ labeled it an A-B-C long term pattern. Why?
Folks, sometimes, I just simply don’t see it. Well, when the ABCD failed – BIG OBTW 🙂 – on Silver I went to the futures chart and said could this be a 1-2 ….? And we have started and are in a WAVE THREE OF THREE? And, that my friends, it exactly what this looks like. I’m bummed I went to the dark side and read some socio-economic and foreign affairs articles about Silver because what I’m about to say really does sound funny because it’s pretty outrageous.
I could easily see Silver, from a long term perspective hitting 200 dollars in the coming days.
Here’s why:

This charts goes back to 1972 folks and, IF my count is correct (obviously the big if) THEN we are going to have a pullback soon, but folks, you want to BUY THIS PULLBACK and I will be hawking it to BUY also as we haven’t even finished wave 3 yet. SILVER IS A BUY. Woah …. IYKYK. The chess match for precious metals has just got a lot more interesting, hasn’t … 200 dollar silver? Again, WOAH.
PS – remember my counting, I try. Give this a 70 percent change of being right? Maybe? 🙂
This was a pretty wild sequence on Lockheed. I had ID’d this pattern a week or so ago and I was on X w/ Ponch and we talked about LMT PATTERN and how it would probably fail (w/ the war and everything) but just look at it and remember what Trump said and then the budget request so … it bounced right off the pattern. Crazy.


Here’s what the pattern failure looks like on a Monthly. There is some resistance approaching but, w/ the big Department of War (why Department of Peace?) asking for a HUGE increase in Defense Spending … yeah, I’m thinking we might pause here or something but this puppy looks STRONG.
BOOM, there’s a PATTERN FAILURE for ya, near real time….


Here’s a fun one – DBA. I’m still long from the low and am thinking higher but we did just finish and ABCD (or close) … two key levels.

Check THIS one out on AMZN. Woah boy …

Folks, check out the measured moves and the harmonics of those measured moves … ZERO technical indicators, zero fundamentals just ‘measured moves.’ Could these be attractor states? Hmmm … if the SAME price movement occurs over and over and over again then … just like the flock of pelicans that came zooming very close by me as I was surfing this AM at Del Mar. (note – it was GLORIOUS) but think about it, just for a second. The pelicans were cruising the waves, or more likely, the air flow that moved due to the energy which is causing the wave to crest and crash producing a ‘force’ that energy can tap into. Wow … or the pod of dolphins which also came thru and I made eye contact w/ one and it was … let me just say, very cool. Even this Sunday, I had 3 dolphins surfing w/ me. Yes, actually surfing the waves and one of them flipped out of the wave as to say “cya dude.” I said to myself “cya dolphin dude.” It was cool … Anyway, these measured moves repeat. If we can find the MONTHLY long term measured moves then we can calculate those moves and there harmonics which is simply noting more than – the ratio’s created from the Vesica Piscis. Wow, pretty cool. I’ll stop for now.
Take all that and here wave have AMZN. Hmmmmm … two projections with extensions make this THE key level for AMZN going any higher in the near term. Would really like to see it go up there and tag that level.
Finally, the ratio appears to be putting in a pretty strong “hammer” candle and, technically, it was in our ‘target zone’ but I do wish it will go down and tag the projected area that we have been watching for months. That being said, looking at the charts above and some others one has to consider, the pattern complete. So, IF the XLP/NYA ratio has bottomed on a MAJOR MONTHLY pattern that has, in the past, been reason to ‘baton down the hatches’ as a correction is coming.
Here’s the link discussing the ratio from a few days ago: https://bartscharts.com/2026/01/05/orientation-update-the-ratio-january-5-2026/
And would you look at that … Mr. Measured Move in percentage terms:

Woah … yup.
What about the USDJPY? Exactly … here ya, go real time:

This is actually a PATTERN called the “crab” where the projection hits the .886.
IF the USD blows thru this level THEN that will give some relief for the global macro picture. It’s just hit the level folks …watch this level closely, because, remember, it came after this:
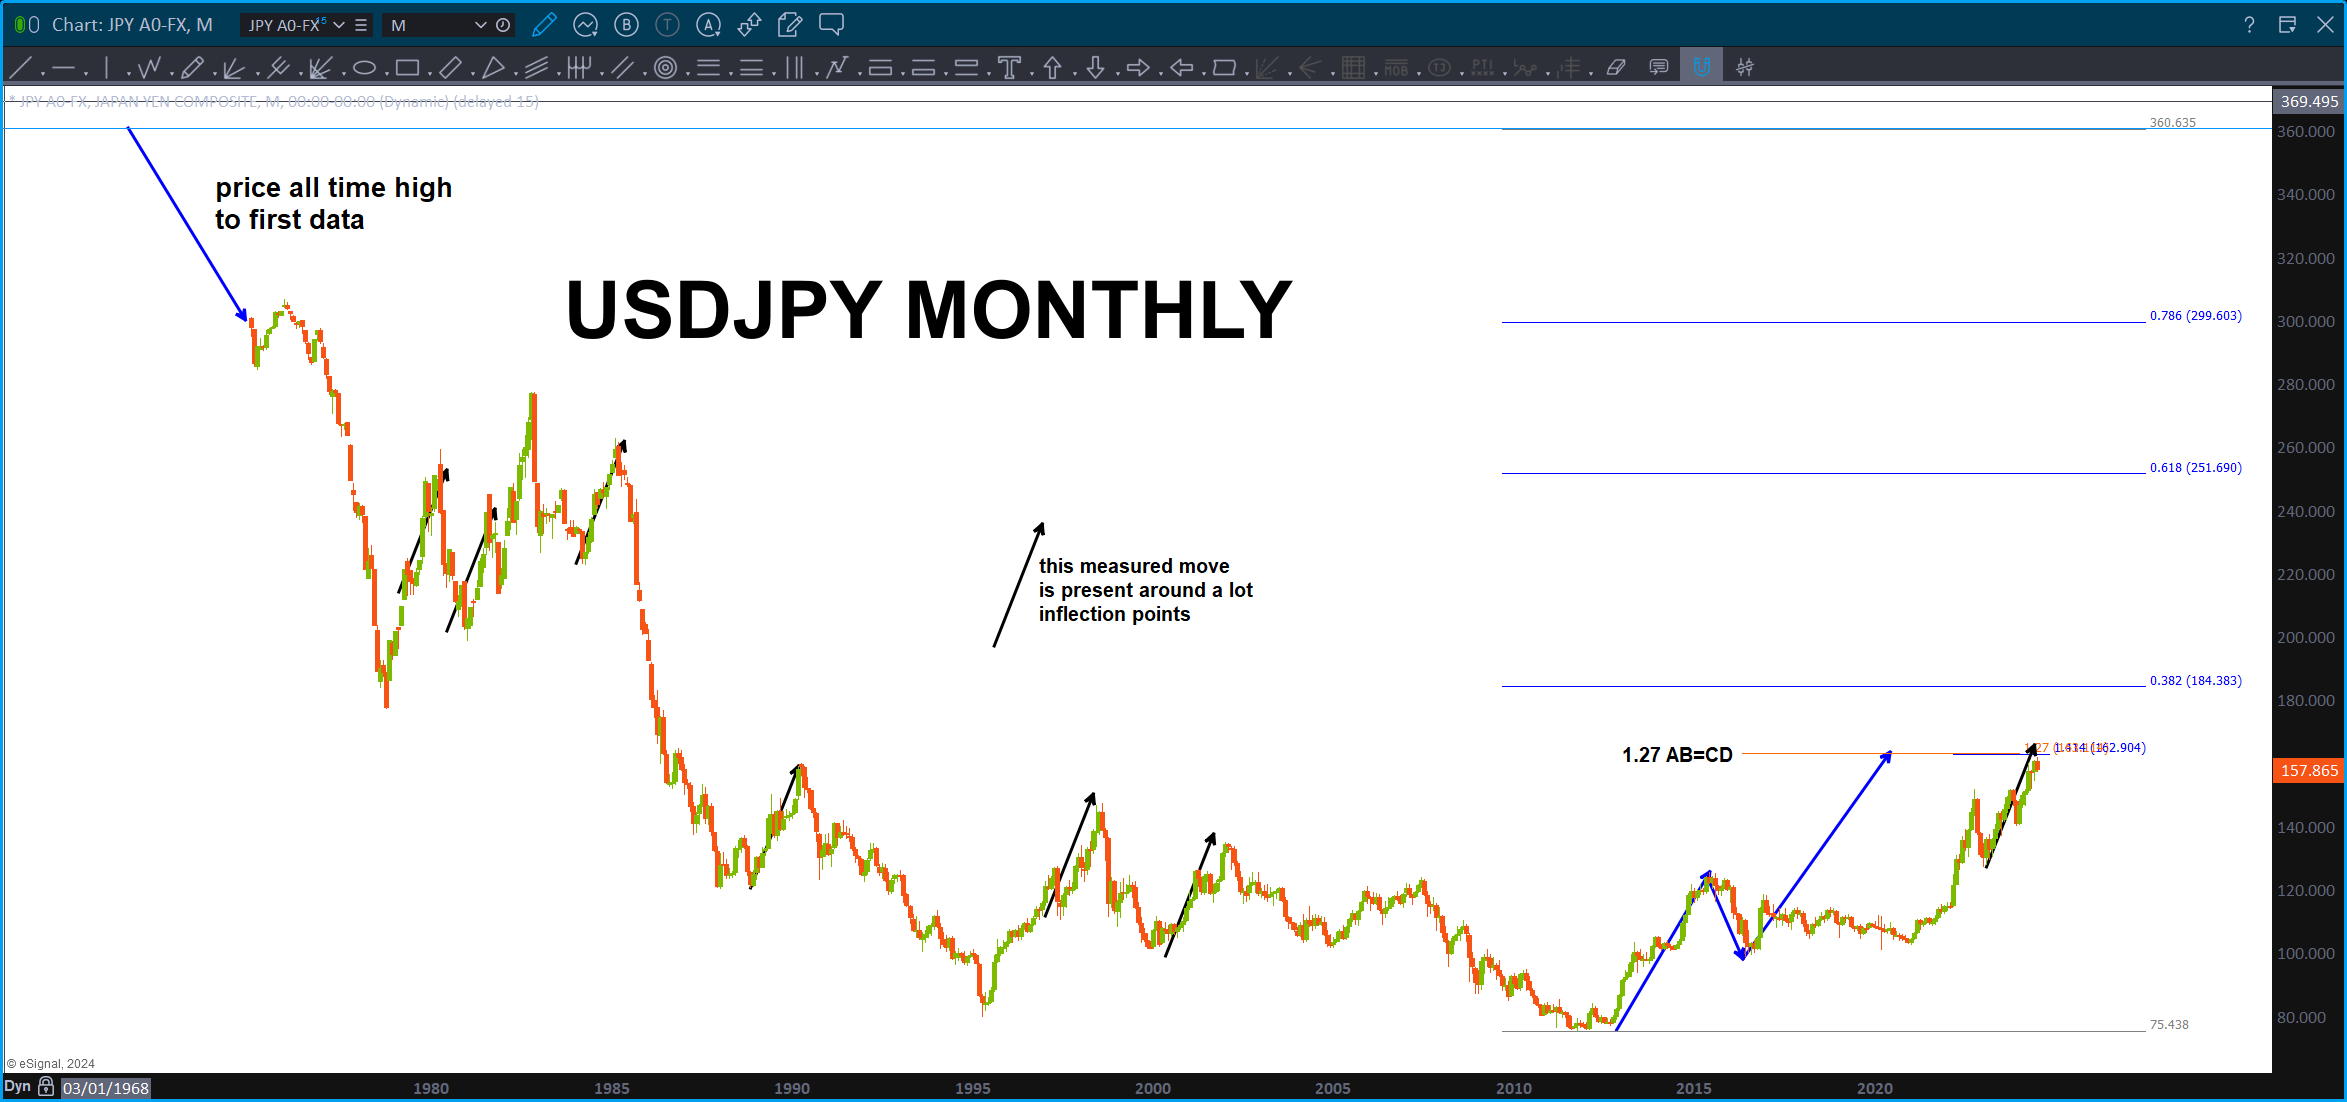
Remember … ? Man, that was a year and half ago! The YEN complex just blew up w/ strength – it was all the patterns. But, some of them have failed so … maybe this does also and off we go? It does work the dollar strength thesis. Again, keep an eye on this for the sole purpose of the carry trade.
KEY: The FX market is the LARGEST market in the world. When I first started trading the FX market it was something like ‘every stock, bond, commodity, futures market would have to trade continuously 90 days to equal one day of liquidity on the FX market.
Here’s what GROK says: Based on the most recent data from the Bank for International Settlements (BIS) Triennial Survey, the average daily turnover in the global FX market reached $9.6 trillion in April 2025.
So, the pattern at play, right now, is going to be KEY. Watch the USDJPY and the entire YEN complex, closely.
Let’s just consider the pattern on the XLP/NYA complete. Which means, support has been found on the XLP/NYA ratio:

We should all know what that means … it’s time to get defensive. Now.
Cut all your positions and run for the hills? I’m not saying that, I’m saying, you might want to take some profit or you might be living thru another round of dollar cost averaging but what if … just if …this was/is a BIG TOP. Hmmmm … guess we’ll just have to wait and see.
Watch for a weekly or monthly signal reversal candle before doing anything too crazy but if we do get them … I would take it seriously.
Hey Bart! I hope you and your family had a great holiday season. Are you still going to be doing your weekly video series, breaking down some charts and fascinating book recommendations?
CW – actually – yes but on my own. I plan on launching a video starting next weekend. Man … seems like everything is converging! Bart