07/30/2017 – we are entering August w/ volatility AT THE ALL TIME low – ever. We also have some pretty cool eclipses coming into play. No kidding, this eclipse is going to be the first one since the inception of the United States that it only goes all the way across our country. Some serious energy is going to be hitting the continental US.
that being said, you can see we were looking at 88-90 ish as potential targets for the XIV but also noted the ‘big candle’ warranted caution for a top/resistance.
we plowed thru those two targets and now have a weekly doji sitting around 93. why did it stop there?
when going to targets I always like to go long term log and also use percentage projections. as you can see if we do a .618ab=cd on the percentage distance it hit the high exactly.
additionally we are also hitting some long term log resistance lines – NOTE I bracketed the gap to come up w/ a zone of resistance.
we have some negative divergence but I really want to keep an eye on that rising dashed green trend line on the RSI …that’s pretty much been running the show…
So, I’m still in the mindset that a correction is coming … mindful to wait for an SRC before jumping in on the LONG VIX or short XIV opportunity.

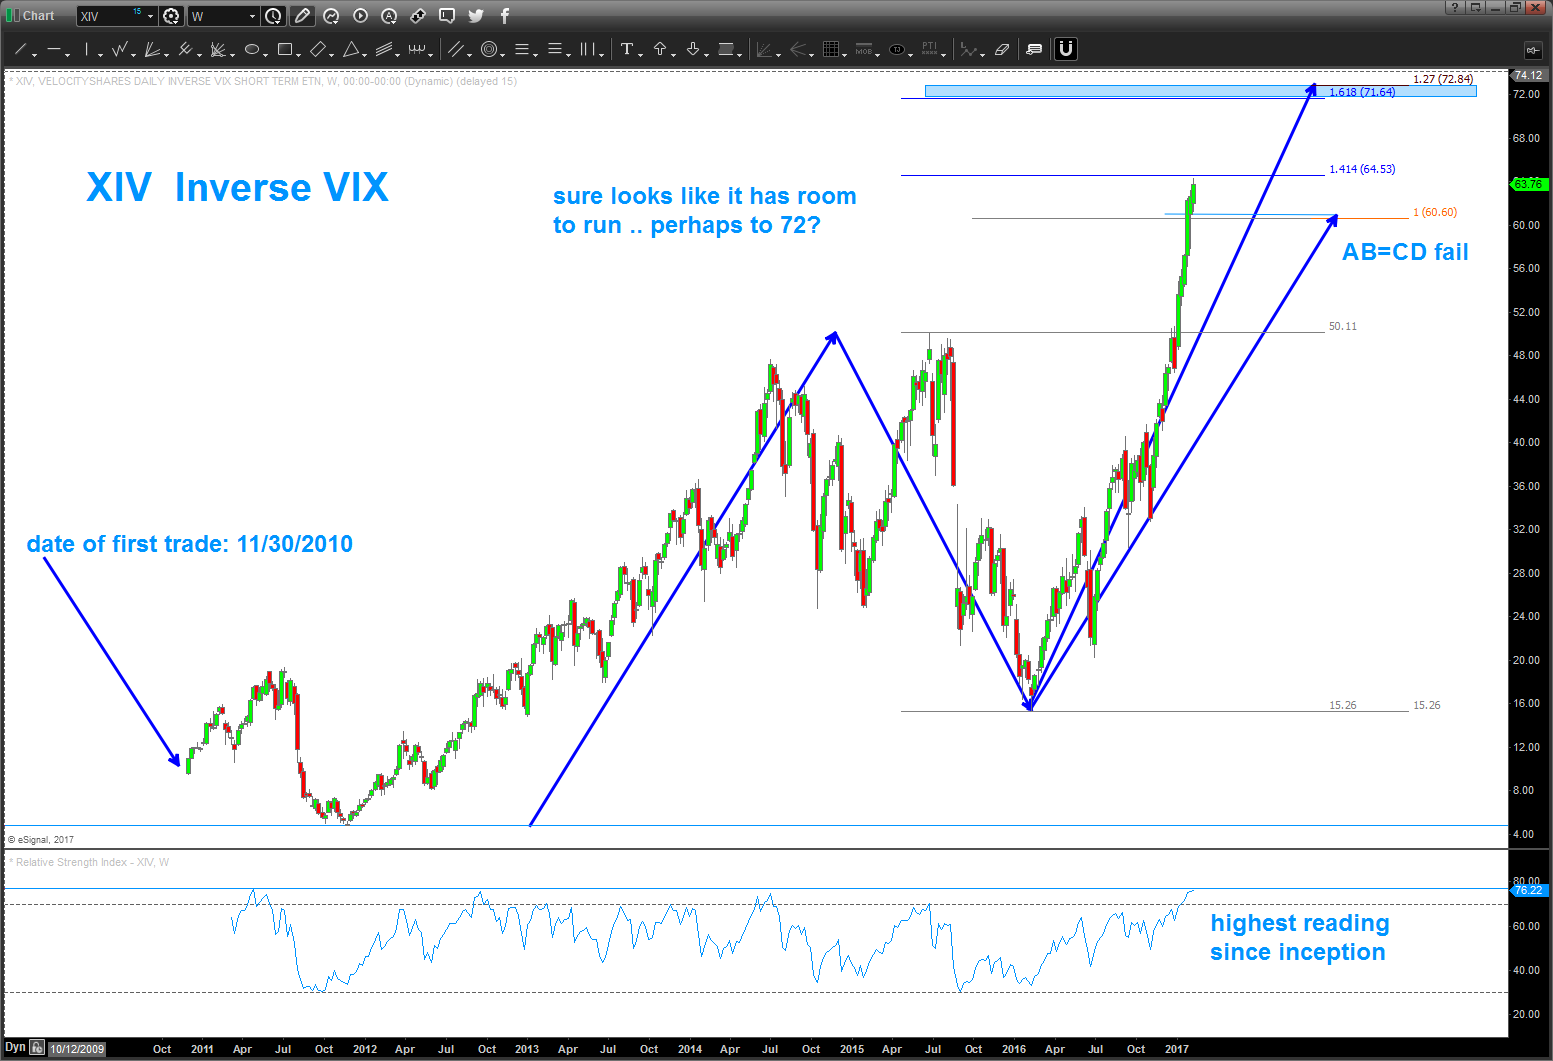
07/16/2017 – NEWS FLASH Volatility is historically low (insert sarcasm here) .. as you can below on the first chart the XIV (inverse VIX) has simply CRUSHED any semblance of patterns as it screams to new highs. Sheesh! But, the more parabolic it becomes the more likely it will parabolically collapse. I’m not saying the market is going to crash all I’m saying is PARABOLIC take off’s NEVER end well. So, ride it while you can …
Below, calling out a very nice 3 drive to a top w/ price and time symmetry and, additionally, the XIV is smacking into 1.618/1.68179 projections from the date of inception. Man, if it smacks into this level and keeps rolling it’s going to be Space-X rocket.
NOTE: if your thinking the VIX is going to spike (XIV to go down) watch out – the candle going into this level is pretty large and bullish …

this chart below is the WEEKLY blown up to capture the most recent price action:

____________________________________________________________________________________________