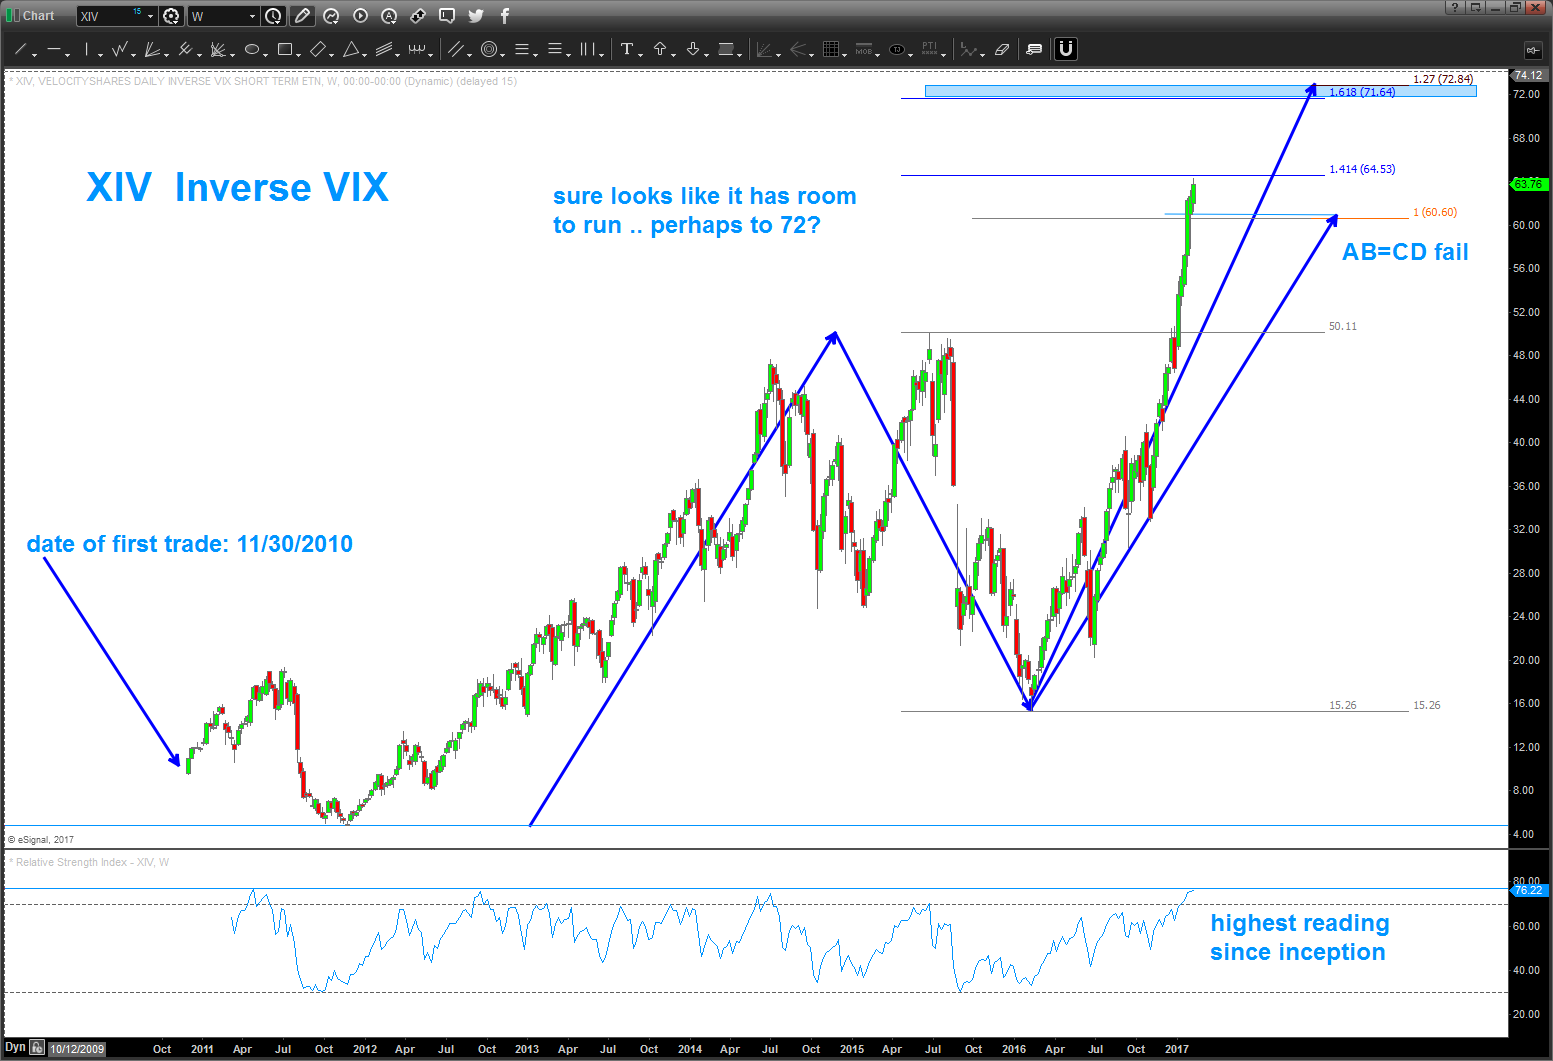
07/16/2017 – NEWS FLASH Volatility is historically low (insert sarcasm here) .. as you can below on the first chart the XIV (inverse VIX) has simply CRUSHED any semblance of patterns as it screams to new highs. Sheesh! But, the more parabolic it becomes the more likely it will parabolically collapse. I’m not saying the market is going to crash all I’m saying is PARABOLIC take off’s NEVER end well. So, ride it while you can …
Below, calling out a very nice 3 drive to a top w/ price and time symmetry and, additionally, the XIV is smacking into 1.618/1.68179 projections from the date of inception. Man, if it smacks into this level and keeps rolling it’s going to be Space-X rocket.
NOTE: if your thinking the VIX is going to spike (XIV to go down) watch out – the candle going into this level is pretty large and bullish …

this chart below is the WEEKLY blown up to capture the most recent price action:

____________________________________________________________________________________________