
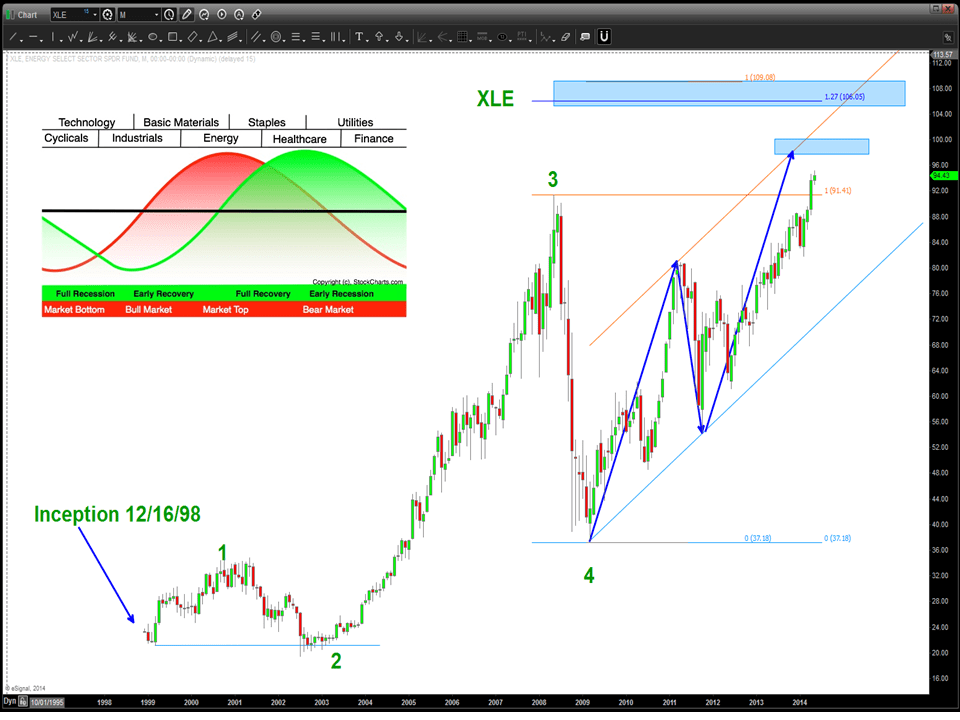
just showing by the chart below 1) a 5 wave count since it’s inception and some targets and 2) the sector rotation guide that shows energy peaking last before the cycles turn down. we have shown many many PATTERNS that are calling for a sell. Some have worked, some haven’t but as you can see the targets depicted on the XLE are just a little higher and then, again, we take pause and adjust accordingly.
One thought on “XLE (Energy) and Sector Rotation …”